Dow Jones Industrial Average rises as Eli Lilly surges, AMD plunges on soft guidance
- The Dow Jones gained around 300 points as Eli Lilly soared on blowout earnings and bullish 2026 guidance.
- Advanced Micro Devices plunged 14% after first-quarter guidance disappointed investors despite record Q4 revenue.
- ADP reported just 22K private-sector jobs added in January, well below expectations of 48K.
- ISM Services PMI held steady at 53.8, marking 19 consecutive months of expansion in the services sector.

The Dow Jones Industrial Average (DJIA) climbed about 600 points, or 0.6%, and tapped the 49,600 region on Wednesday, gaining ground on the back of climbing pharmaceutical stocks. The S&P 500 shed approximately 0.5% while the Nasdaq Composite dropped 1.4%, weighed down by continued weakness in semiconductor and software stocks. Markets remained in rotation mode, with investors moving out of technology and into economically sensitive shares amid ongoing concerns about AI-driven disruption.
Eli Lilly crushes estimates, revenue rises above Wall Street expectations
Eli Lilly and Company (LLY) surged more than 7% after the pharmaceutical giant posted fourth-quarter results that blew past analyst expectations. The company reported adjusted earnings of $7.54 per share on revenue of $19.29 billion, well ahead of estimates for $6.93 and $17.96 billion. Lilly's blockbuster weight-loss drug Zepbound and diabetes treatment Mounjaro continued to drive growth, with Zepbound generating $4.2 billion in US revenue for the quarter. The company provided guidance for 2026 revenue between $80 billion and $83 billion, significantly above the $77.62 billion analysts had forecast. The results stood in stark contrast to rival Novo Nordisk A/S (NVO), which warned earlier this week that it expects sales and profit to decline as much as 13% this year. Lilly's market share in the US obesity and diabetes drug market climbed to 60.5% in the fourth quarter.
AMD sinks despite record revenue as guidance disappoints
Advanced Micro Devices Inc. (AMD) plunged 14% on Wednesday after its first-quarter guidance fell short of elevated expectations amid the ongoing AI spending boom. The chipmaker projected revenue of approximately $9.8 billion for the first quarter, plus or minus $300 million, which topped the consensus estimate of $9.38 billion but disappointed analysts who had anticipated stronger guidance. AMD reported record fourth-quarter revenue of $10.27 billion and earnings of $1.53 per share, both beating estimates, but investors focused on the sequential revenue decline implied by the guidance. The stock's slide weighed heavily on the Nasdaq and added to pressure on the broader semiconductor sector, with Broadcom Inc. (AVGO) falling 2% and Micron Technology Inc. (MU) losing 3%.
ADP report shows sluggish hiring to start 2026
Private-sector employment barely budged in January, with companies adding just 22K jobs according to the ADP National Employment Report released Wednesday. The figure was well below the downwardly revised 37K increase in December and missed the Dow Jones consensus forecast of 48K. The lackluster reading would have been negative without a surge of 74K hires in the education and health services category. Financial activities added 14K positions while construction rose by just 9K. ADP Chief Economist Nela Richardson noted that hiring continues to soften in a pattern observed over the past three years. Wage gains were little changed, with job-stayers seeing growth of 4.5% year-over-year. The Bureau of Labor Statistics' (BLS) Nonfarm Payrolls (NFP) report, originally scheduled to release on Friday, has been delayed by the recent partial government shutdown.
ISM Services PMI holds steady, pointing to continued expansion
The ISM Services PMI registered 53.8 in January, unchanged from December's seasonally adjusted reading, marking the 19th consecutive month of expansion in the services sector. The Business Activity Index jumped to 57.4, up 2.2 points from December and the highest reading since October 2024. The Employment Index expanded for the second straight month at 50.3, though it slipped 1.4 points from December. The Prices Index rose to 66.6, slightly above its 12-month average, suggesting inflationary pressures remain in the services sector. ISM noted that the Services PMI reading corresponds to a 1.8 percentage point increase in real gross domestic product on an annualized basis, indicating continued economic expansion.
Software stocks extend global selloff on AI disruption fears
The rout in software stocks extended into a second day as concerns about artificial intelligence disrupting traditional business models continued to weigh on the sector. Salesforce Inc. (CRM), Oracle Corporation (ORCL), and CrowdStrike Holdings Inc. (CRWD) all extended losses from Tuesday's session. The iShares Expanded Tech-Software Sector ETF has dropped more than 14% over the past six sessions following a 15% decline in January. The selling has spilled over into global markets, with European software and data analytics names hitting fresh lows. Analysts at Jefferies described software sentiment as the worst ever, with traders in capitulation mode. Gold continued its recovery, climbing to around $5,050 per ounce as investors sought safe-haven assets amid the technology sector turmoil.
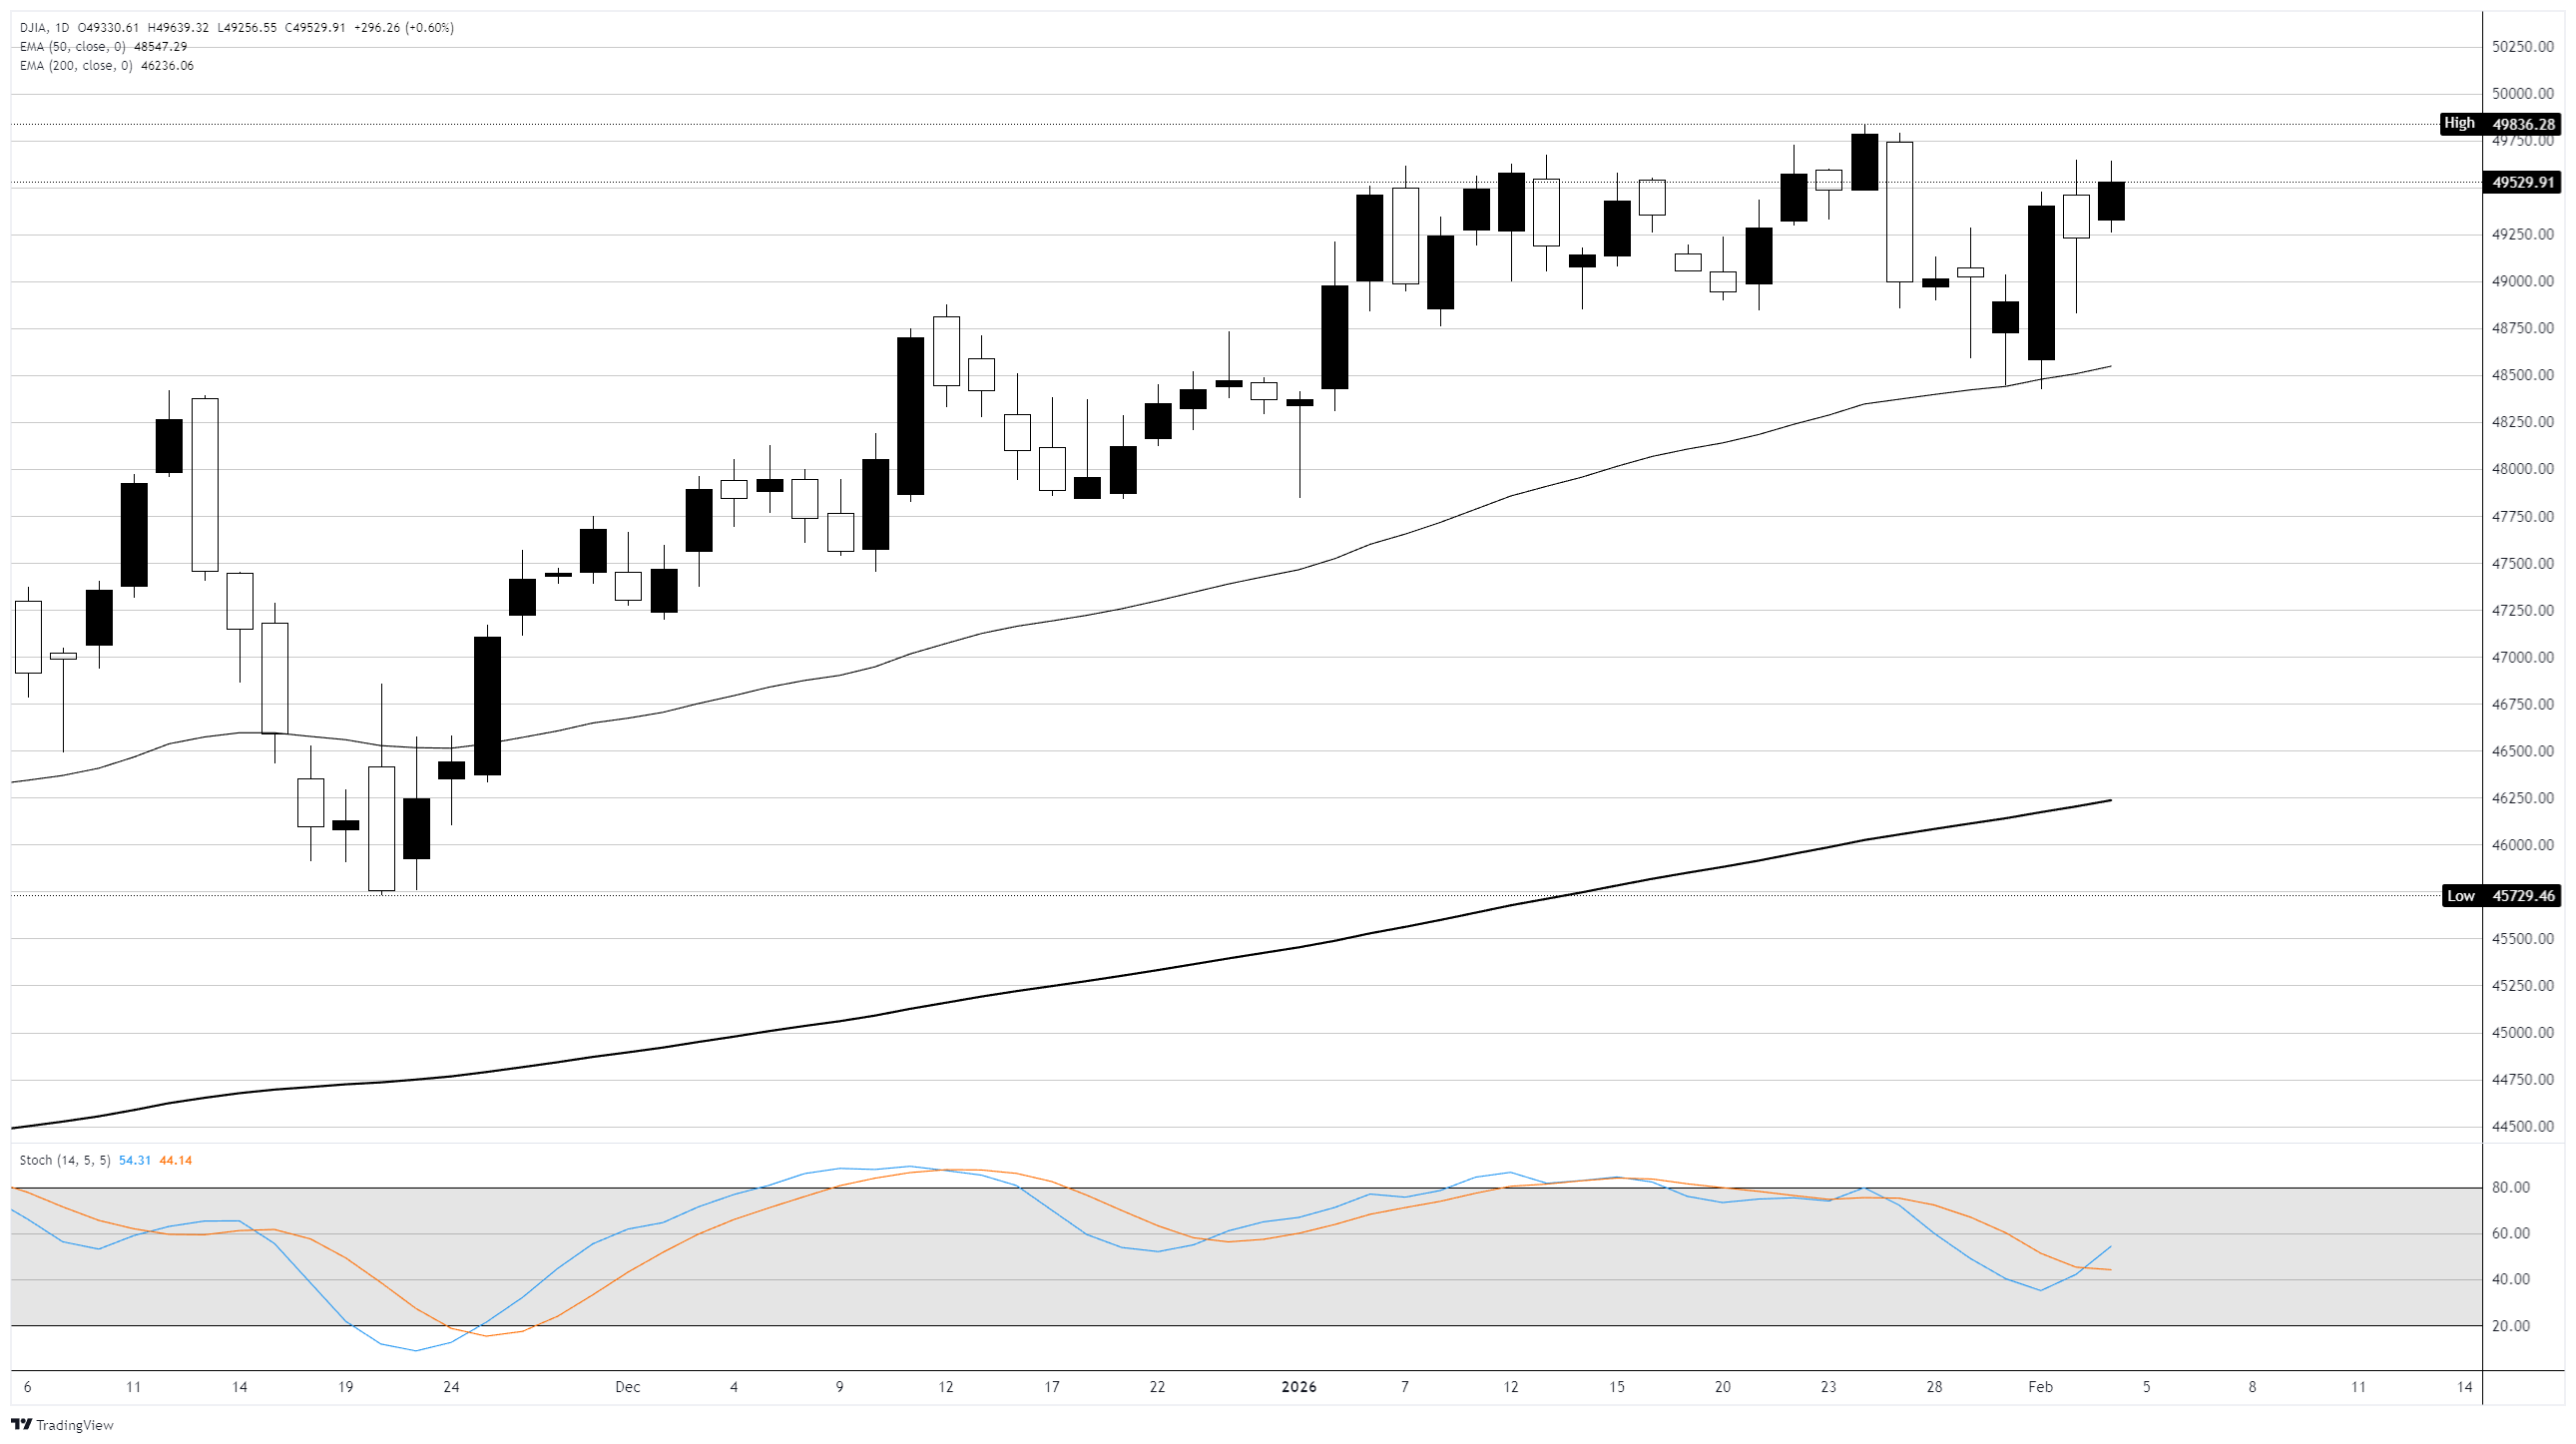
Dow Jones daily chart
Dow Jones FAQs
The Dow Jones Industrial Average, one of the oldest stock market indices in the world, is compiled of the 30 most traded stocks in the US. The index is price-weighted rather than weighted by capitalization. It is calculated by summing the prices of the constituent stocks and dividing them by a factor, currently 0.152. The index was founded by Charles Dow, who also founded the Wall Street Journal. In later years it has been criticized for not being broadly representative enough because it only tracks 30 conglomerates, unlike broader indices such as the S&P 500.
Many different factors drive the Dow Jones Industrial Average (DJIA). The aggregate performance of the component companies revealed in quarterly company earnings reports is the main one. US and global macroeconomic data also contributes as it impacts on investor sentiment. The level of interest rates, set by the Federal Reserve (Fed), also influences the DJIA as it affects the cost of credit, on which many corporations are heavily reliant. Therefore, inflation can be a major driver as well as other metrics which impact the Fed decisions.
Dow Theory is a method for identifying the primary trend of the stock market developed by Charles Dow. A key step is to compare the direction of the Dow Jones Industrial Average (DJIA) and the Dow Jones Transportation Average (DJTA) and only follow trends where both are moving in the same direction. Volume is a confirmatory criteria. The theory uses elements of peak and trough analysis. Dow’s theory posits three trend phases: accumulation, when smart money starts buying or selling; public participation, when the wider public joins in; and distribution, when the smart money exits.
There are a number of ways to trade the DJIA. One is to use ETFs which allow investors to trade the DJIA as a single security, rather than having to buy shares in all 30 constituent companies. A leading example is the SPDR Dow Jones Industrial Average ETF (DIA). DJIA futures contracts enable traders to speculate on the future value of the index and Options provide the right, but not the obligation, to buy or sell the index at a predetermined price in the future. Mutual funds enable investors to buy a share of a diversified portfolio of DJIA stocks thus providing exposure to the overall index.
Author

Joshua Gibson
FXStreet
Joshua joins the FXStreet team as an Economics and Finance double major from Vancouver Island University with twelve years' experience as an independent trader focusing on technical analysis.


