Dow Jones Industrial Average rebounds after cooling PPI inflation figures
- The Dow Jones pushed back up into the 43,000 region after upbeat PPI inflation print.
- Market expectations of Fed rate cuts later this year have roared back to life.
- Despite low inflation data this week, potential price impacts from tariffs still loom ahead.

The Dow Jones Industrial Average (DJIA) caught a bullish bid on Thursday, bolstered by better-than-expected Producer Price Index (PPI) inflation data for May. Pricing pressures remain tepid despite the Trump administration’s best efforts to make the US economy pay excess international trade taxes, and the lack of immediate price volatility impacts are re-igniting market expectations of a Federal Reserve (Fed) rate cut in September.
PPI inflation rebounded in May, and previous data saw a slight upward revision, but the overall figures still came in below median market forecasts. Annualized core PPI inflation eased to 3.0% YoY, while headline PPI inflation rose to 2.6% YoY.
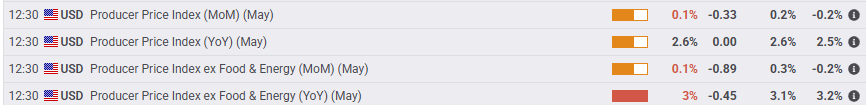
This week’s overall tepid inflation data for both consumers and producers has galvanized market bets for the start of the Fed’s next rate-cutting cycle. According to the CME’s FedWatch Tool, rate traders are pricing in nearly 80% odds of at least a 25 basis point rate trim when the Fed gathers for its September rate call. In the meantime, the Fed is expected to continue holding rates flat for the next two rate meetings.
The University of Michigan’s (UoM) Consumer Sentiment Index for June will land on markets on Friday to wrap up the trading week, and median market forecasts expect an overall rebound in aggregated consumer sentiment survey results. Investors will also keep a close eye on the UoM’s 1-year and 5-year Consumer Inflation Expectations, which are holding uncomfortably high at 6.6% and 4.2%, respectively.
Dow Jones price forecast
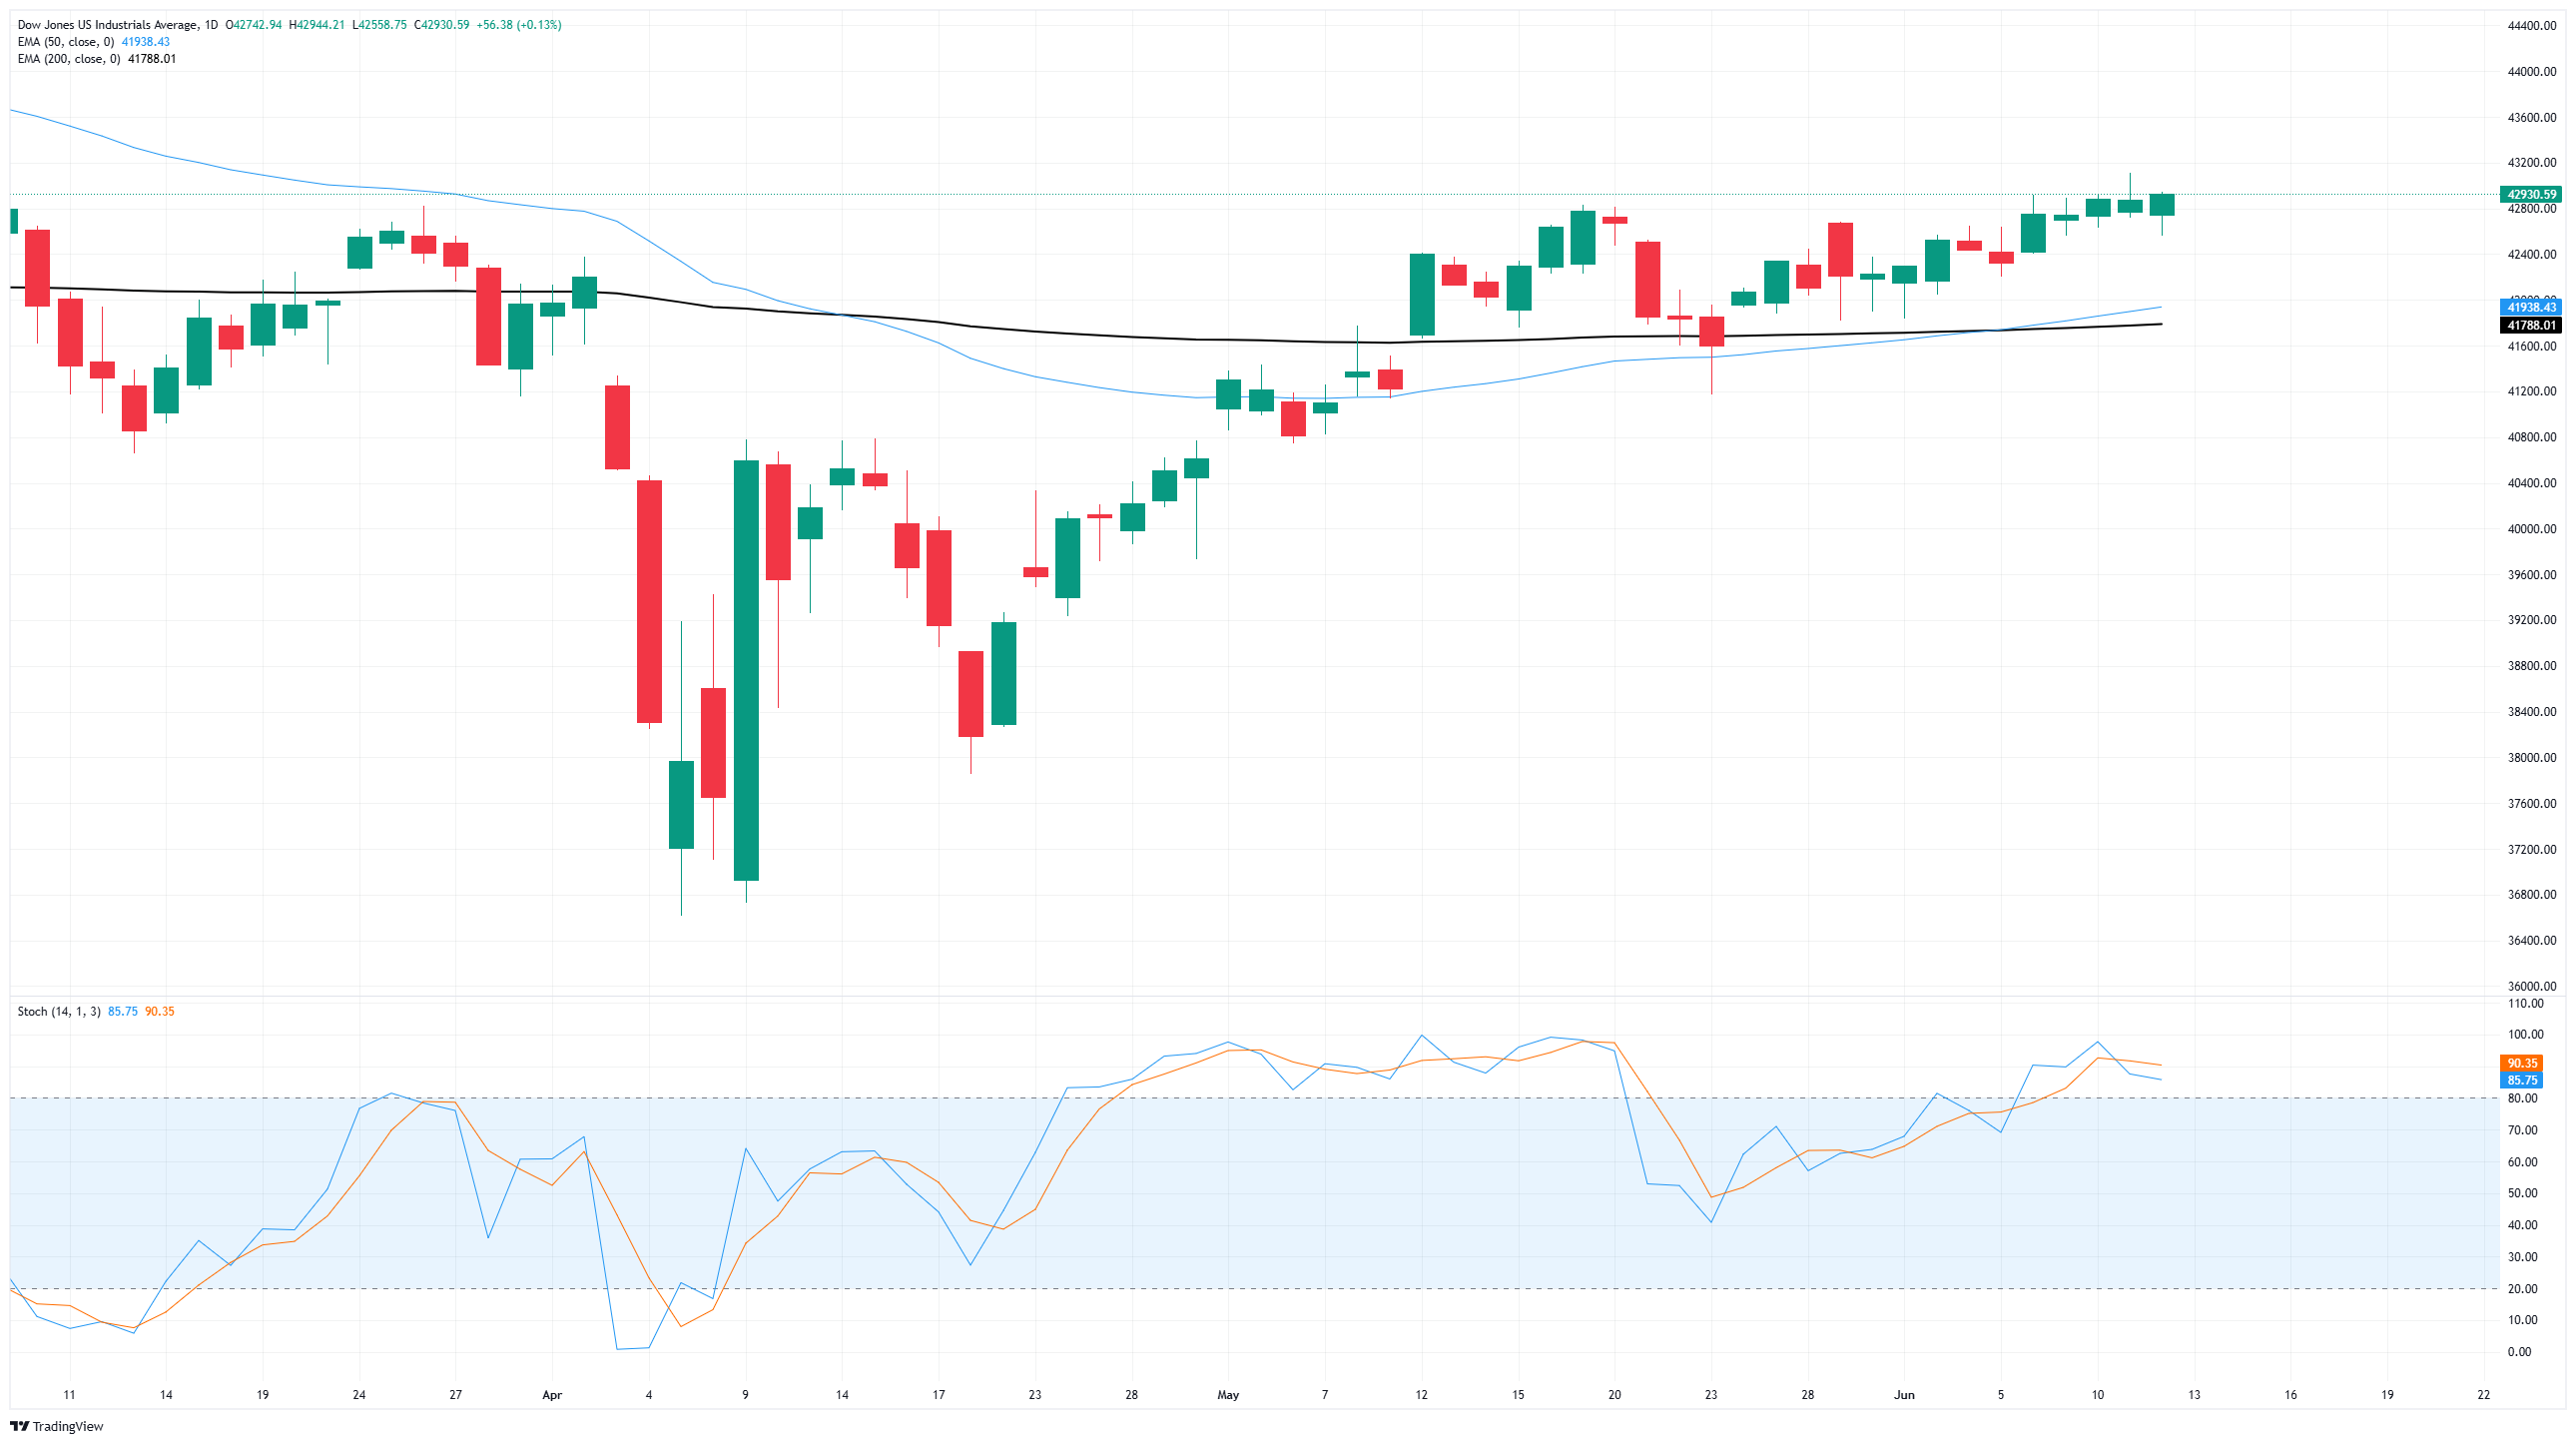
Thursday’s bullish push is keeping the Dow Jones Industrial Average within touch range of the 43,000 major price handle, but meaningful momentum remains limited. Price action continues to get mired in a recent congestion zone, and the major equity index is struggling to put distance between bids and the 200-day Exponential Moving Average (EMA) near 41,780.
Dow Jones daily chart
Dow Jones FAQs
The Dow Jones Industrial Average, one of the oldest stock market indices in the world, is compiled of the 30 most traded stocks in the US. The index is price-weighted rather than weighted by capitalization. It is calculated by summing the prices of the constituent stocks and dividing them by a factor, currently 0.152. The index was founded by Charles Dow, who also founded the Wall Street Journal. In later years it has been criticized for not being broadly representative enough because it only tracks 30 conglomerates, unlike broader indices such as the S&P 500.
Many different factors drive the Dow Jones Industrial Average (DJIA). The aggregate performance of the component companies revealed in quarterly company earnings reports is the main one. US and global macroeconomic data also contributes as it impacts on investor sentiment. The level of interest rates, set by the Federal Reserve (Fed), also influences the DJIA as it affects the cost of credit, on which many corporations are heavily reliant. Therefore, inflation can be a major driver as well as other metrics which impact the Fed decisions.
Dow Theory is a method for identifying the primary trend of the stock market developed by Charles Dow. A key step is to compare the direction of the Dow Jones Industrial Average (DJIA) and the Dow Jones Transportation Average (DJTA) and only follow trends where both are moving in the same direction. Volume is a confirmatory criteria. The theory uses elements of peak and trough analysis. Dow’s theory posits three trend phases: accumulation, when smart money starts buying or selling; public participation, when the wider public joins in; and distribution, when the smart money exits.
There are a number of ways to trade the DJIA. One is to use ETFs which allow investors to trade the DJIA as a single security, rather than having to buy shares in all 30 constituent companies. A leading example is the SPDR Dow Jones Industrial Average ETF (DIA). DJIA futures contracts enable traders to speculate on the future value of the index and Options provide the right, but not the obligation, to buy or sell the index at a predetermined price in the future. Mutual funds enable investors to buy a share of a diversified portfolio of DJIA stocks thus providing exposure to the overall index.
Author

Joshua Gibson
FXStreet
Joshua joins the FXStreet team as an Economics and Finance double major from Vancouver Island University with twelve years' experience as an independent trader focusing on technical analysis.


