Dow Jones Industrial Average struggles amid earnings misses
- The Dow Jones was flat on Tuesday after the tech rally sputtered, dragging chip stocks lower.
- Trump continues his campaign against Fed Chair Powell.
- Investors fumbled their bullish stance as earnings season sees a few dark spots.

The Dow Jones Industrial Average (DJIA) remains trapped in consolidation around the 44,400 region on Tuesday. Earnings week is in full swing, and a few key misses on Tuesday gave investors cause for pause, twisting a kink into the tech rally and dragging down key blue chips.
United States (US) President Donald Trump still has a lot to say about Federal Reserve (Fed) Chair Jerome Powell. The Trump administration is actively campaigning against the Fed head as Trump looks for a way to dump his own pick for head of the Fed ahead of schedule. According to Donald Trump, US interest rates should be at or near 1%, depending on which math Trump uses from one moment to the next.
Earnings season has overall been a positive with analyst expectations set low enough that over 80% of reporting companies have beat the street. However, key misses on Tuesday crimped investor sentiment, with defense manufacturer Lockheed Martin (LMT) falling to a 52-week low after missing Q2 revenue expectations. Tobacco giant Phillip Morris (PM) also fell short of earnings estimates, dipping around 8% on the day at its lowest point.
AI, airplanes and tobacco
Tech stocks took a hit on Tuesday as the incredibly overweight sector began to show signs of further strain. AI rally darling Nvidia (NVDA) took a 2% hit after a Wall Street Journal report highlighted that the $500B Starlink megaproject, jointly funded by SoftBank and OpenAI, has run into some early snags and now has to scale down expectations of what they will be able to deliver on their original timeline. Semiconductors also took a hit on Tuesday as earnings for computer hardware materials suppliers underperformed forecasts.
Google-owner Alphabet (GOOGL) and Tesla (TSLA) will be kicking off earnings for the megacap ‘magnificent seven’ stocks on Wednesday. A significant portion of Wall Street’s earnings expectations are expected to be met by the two tech giants.
Read more stock news: Coca-Cola stock sinks after missing quarterly revenue consensus
Dow Jones price forecast
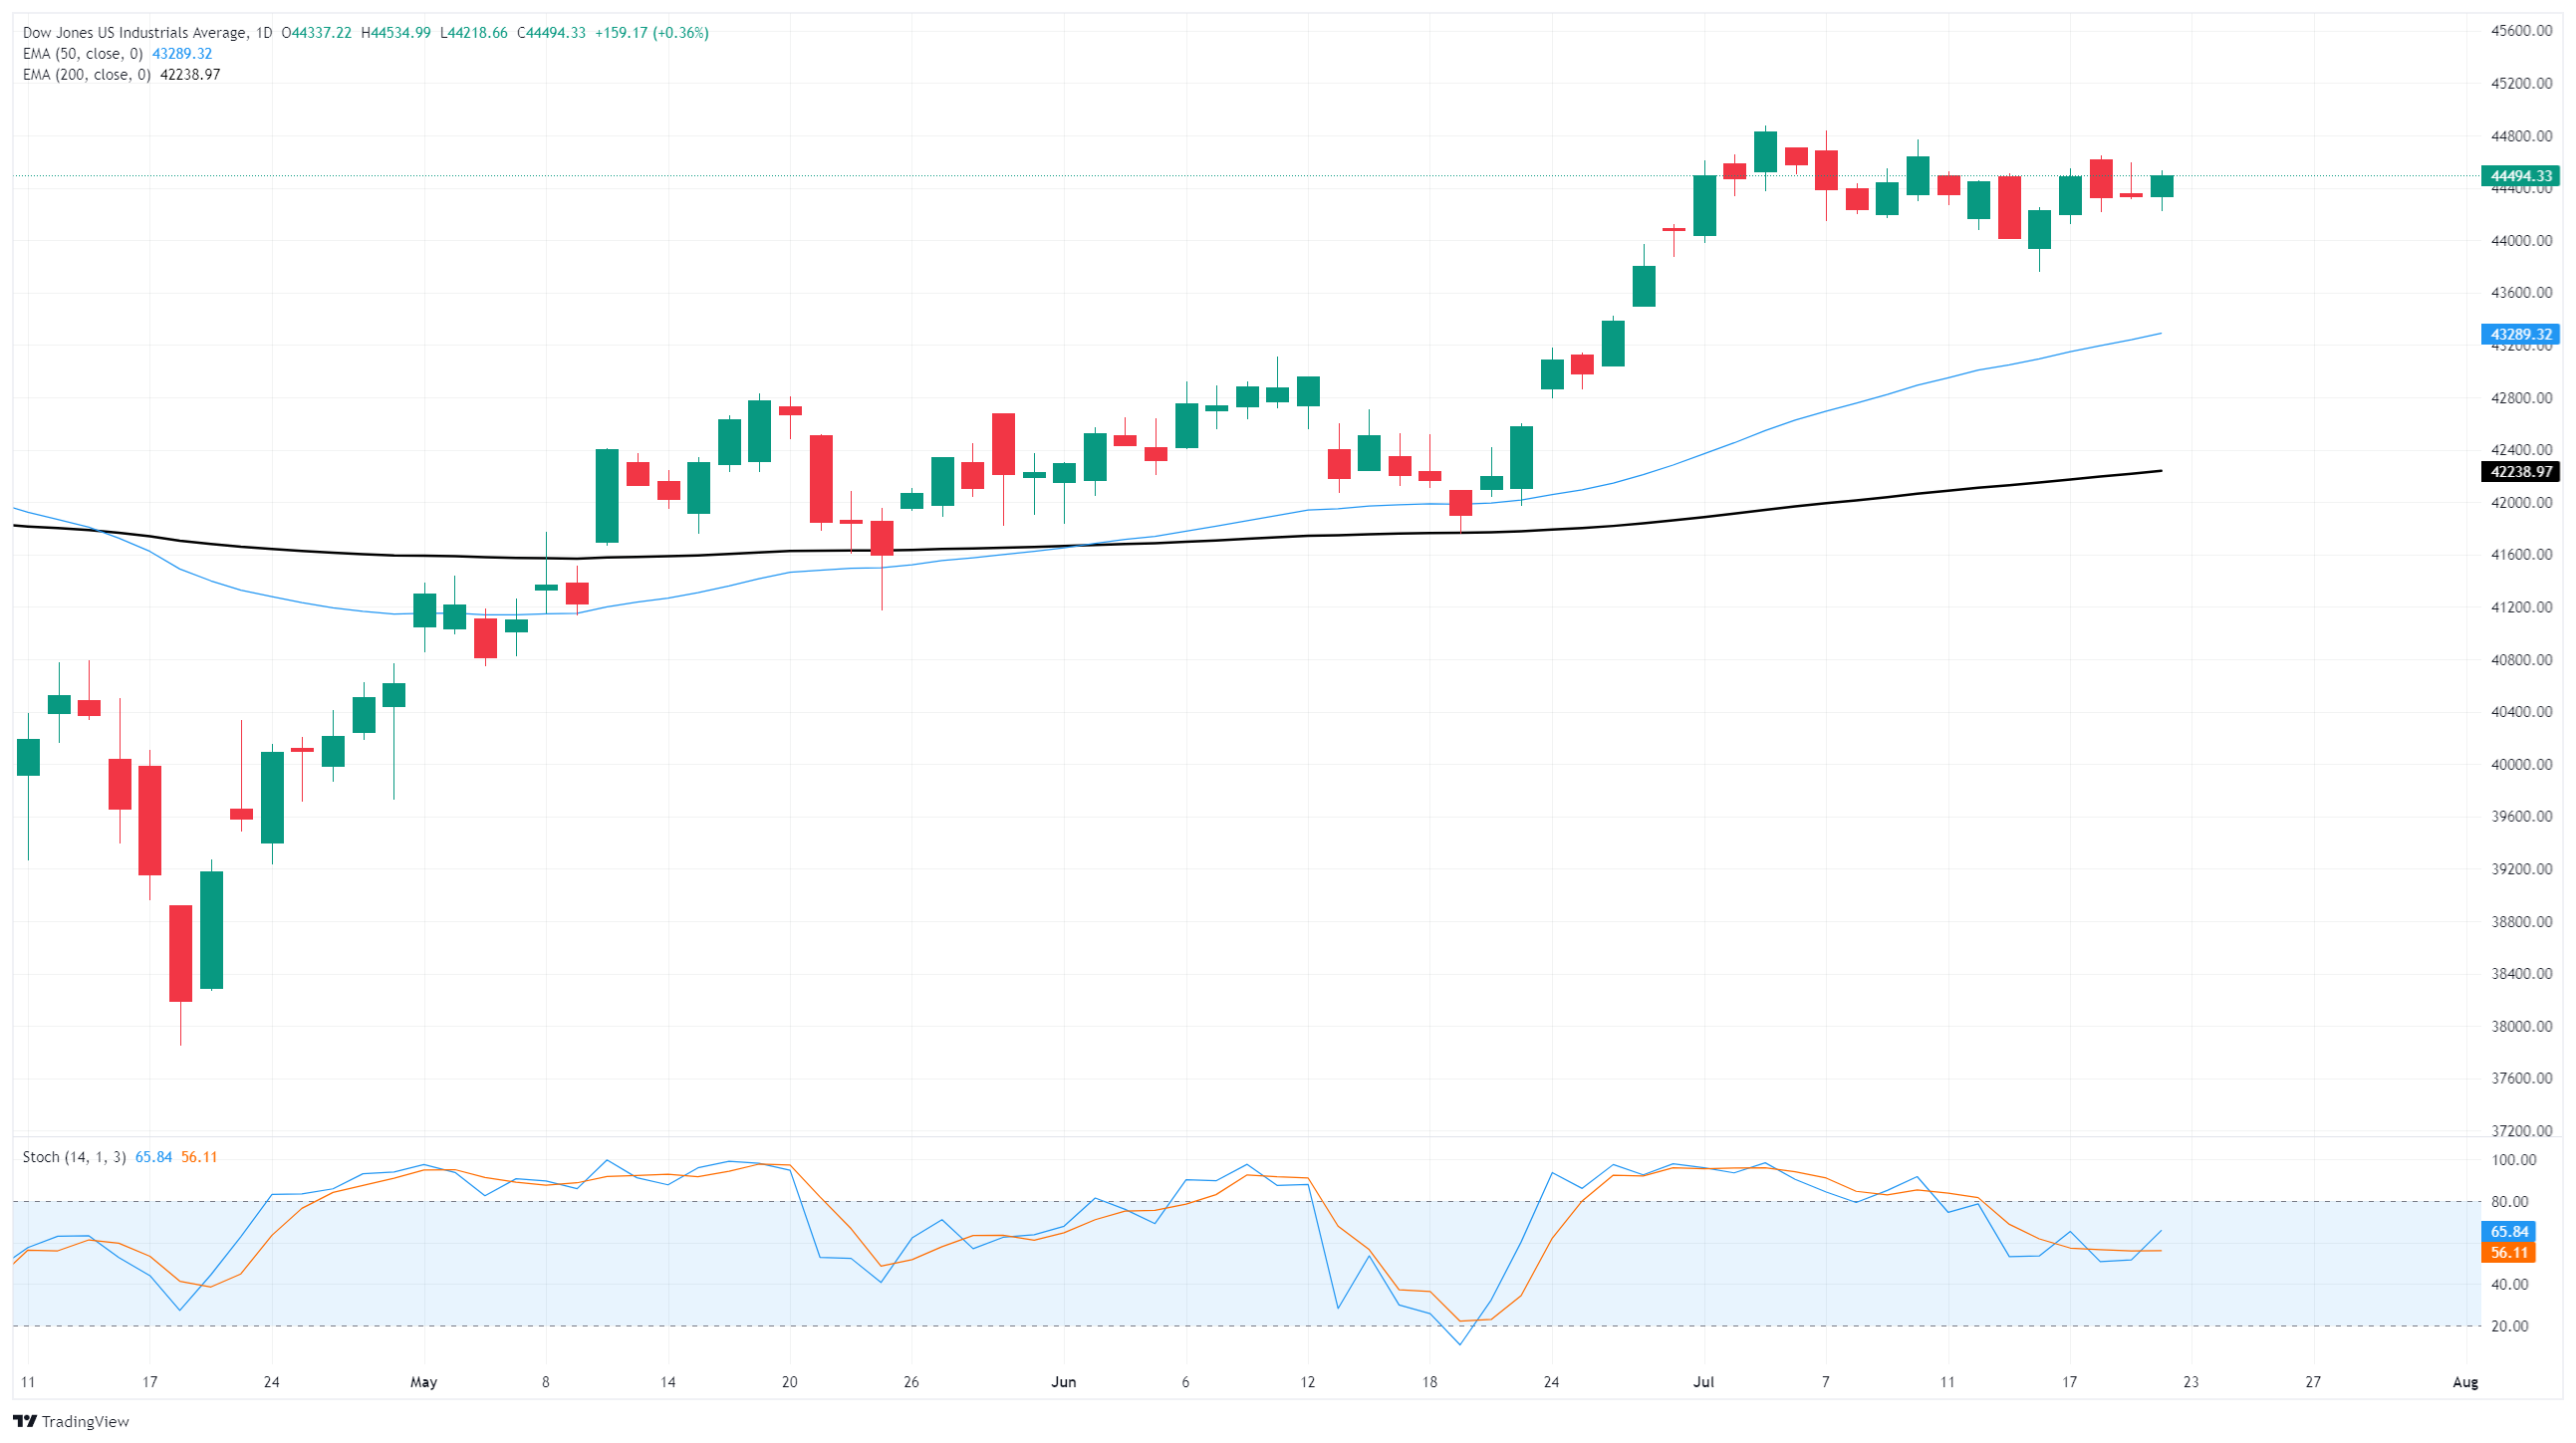
Middling performance has become the name of the game for the Dow Jones. Price action is firmly pinned in a consolidation range between 44,800 and 44,000. The Dow’s latest bullish push has left the major equity index stranded in no man’s land without enough momentum to reclaim new record highs north of 45,000. However, downside technical levels are tricky to nail down with the DJIA outpacing its own moving averages by a significant margin.
Dow Jones daily chart
Dow Jones FAQs
The Dow Jones Industrial Average, one of the oldest stock market indices in the world, is compiled of the 30 most traded stocks in the US. The index is price-weighted rather than weighted by capitalization. It is calculated by summing the prices of the constituent stocks and dividing them by a factor, currently 0.152. The index was founded by Charles Dow, who also founded the Wall Street Journal. In later years it has been criticized for not being broadly representative enough because it only tracks 30 conglomerates, unlike broader indices such as the S&P 500.
Many different factors drive the Dow Jones Industrial Average (DJIA). The aggregate performance of the component companies revealed in quarterly company earnings reports is the main one. US and global macroeconomic data also contributes as it impacts on investor sentiment. The level of interest rates, set by the Federal Reserve (Fed), also influences the DJIA as it affects the cost of credit, on which many corporations are heavily reliant. Therefore, inflation can be a major driver as well as other metrics which impact the Fed decisions.
Dow Theory is a method for identifying the primary trend of the stock market developed by Charles Dow. A key step is to compare the direction of the Dow Jones Industrial Average (DJIA) and the Dow Jones Transportation Average (DJTA) and only follow trends where both are moving in the same direction. Volume is a confirmatory criteria. The theory uses elements of peak and trough analysis. Dow’s theory posits three trend phases: accumulation, when smart money starts buying or selling; public participation, when the wider public joins in; and distribution, when the smart money exits.
There are a number of ways to trade the DJIA. One is to use ETFs which allow investors to trade the DJIA as a single security, rather than having to buy shares in all 30 constituent companies. A leading example is the SPDR Dow Jones Industrial Average ETF (DIA). DJIA futures contracts enable traders to speculate on the future value of the index and Options provide the right, but not the obligation, to buy or sell the index at a predetermined price in the future. Mutual funds enable investors to buy a share of a diversified portfolio of DJIA stocks thus providing exposure to the overall index.
Author

Joshua Gibson
FXStreet
Joshua joins the FXStreet team as an Economics and Finance double major from Vancouver Island University with twelve years' experience as an independent trader focusing on technical analysis.