Dow Jones Industrial Average Forecast: DJIA hits new all-time high on excitement over dovish Fed Dot Plot
- Dow Jones Industrial Index rose 0.01% last week, ensuring that the index would gain for a sixth straight week.
- DJIA surged 1% late Wednesday after Fed reported more openness to further rate cuts in 2024.
- Federal Reserve governors determined that interest rates were likely to be trimmed earlier than expected.
- CPI inflation on Tuesday arrived in line with consensus, boosting equities.
- US Treasury yields fall on Wednesday as stocks rise.
The Dow Jones Industrial Average (DJIA) rose sharply on Wednesday after the Federal Reserve (Fed) released a new Dot Plot showing that its projection for interest rates one year out fell by 50 basis points from the last release. This forced the DJIA from a flat stance before the print to a 1% surge as the index reached an all-time high above 37,000. Before the release, the Dow had been underperforming the S&P 500 and NASDAQ Composite. Following the Fed's Dot Plot, however, the Dow Jones took the lead among US indices.
This will be the seventh straight week of gains if the index can hold through Friday since it is already up nearly 1% on the week. US Treasury yields dropped sharply as well on the news. The 2-year and 5-year Treasuries both saw their yields plummet by more than 3%.
Dow Jones News: Dot Plot shows Fed governors ready to cut
The stock market sure liked what they got from the Fed on Wednesday. The 1-year Interest Rate Project dropped from 5.1% to 4.6%, while the 2-year outlook fell from 3.9% to 3.6%.
The central bank also kept current rates flat at its existing range between 5.25% and 5.5%. The three year outlook remained unchanged at 2.9%, while the current outlook dropped from 5.6% to 5.4%.
The CME FedWatch Tool's estimate for a cut at the Fed's March meeting surged from 41% on Tuesday to 73% after the Fed release.
Fed Chair Jerome Powell said the US economy was humming along but admitted that 2024 could witness a recession. This would engender steeper and quicker rate cuts, so the stock market ate that news up.
The US central bank is now estimating that interest rates could fall by 90 basis points by the end of next year. The previous Dot Plot, released in the autumn, showed the Fed governors predicting just 50 basis points of cuts all year long.
Nasdaq FAQs
What is the Nasdaq?
The Nasdaq is a stock exchange based in the US that started out life as an electronic stock quotation machine. At first, the Nasdaq only provided quotations for over-the-counter (OTC) stocks but later it became an exchange too. By 1991, the Nasdaq had grown to account for 46% of the entire US securities’ market. In 1998, it became the first stock exchange in the US to provide online trading. The Nasdaq also produces several indices, the most comprehensive of which is the Nasdaq Composite representing all 2,500-plus stocks on the Nasdaq, and the Nasdaq 100.
What is the Nasdaq 100?
The Nasdaq 100 is a large-cap index made up of 100 non-financial companies from the Nasdaq stock exchange. Although it only includes a fraction of the thousands of stocks in the Nasdaq, it accounts for over 90% of the movement. The influence of each company on the index is market-cap weighted. The Nasdaq 100 includes companies with a significant focus on technology although it also encompasses companies from other industries and from outside the US. The average annual return of the Nasdaq 100 has been 17.23% since 1986.
How can I trade the Nasdaq 100?
There are a number of ways to trade the Nasdaq 100. Most retail brokers and spread betting platforms offer bets using Contracts for Difference (CFD). For longer-term investors, Exchange-Traded Funds (ETFs) trade like shares that mimic the movement of the index without the investor needing to buy all 100 constituent companies. An example ETF is the Invesco QQQ Trust (QQQ). Nasdaq 100 futures contracts allow traders to speculate on the future direction of the index. Options provide the right, but not the obligation, to buy or sell the Nasdaq 100 at a specific price (strike price) in the future.
What Factors Drive the Nasdaq 100
Many different factors drive the Nasdaq 100 but mainly it is the aggregate performance of the component companies revealed in their quarterly and annual company earnings reports. US and global macroeconomic data also contributes as it impacts on investor sentiment, which if positive drives gains. The level of interest rates, set by the Federal Reserve (Fed), also influences the Nasdaq 100 as it affects the cost of credit, on which many corporations are heavily reliant. As such the level of inflation can be a major driver too as well as other metrics which impact on the decisions of the Fed.
Dow Jones Industrial Average forecast: Can the rally continue?
The Dow Jones index is rising for its seventh consecutive week. More importantly, the DJIA reached a new all-time high of 37,057, surpassing the previous record of 36,952 from early 2022.
Yes, the DJIA needs to consolidate at some point, but the market is overjoyed by the central bank's new openness to stronger rate-cutting action in 2024.
The index rose just 0.01% last week when everyone figured that it would be the first down week since October. The fact that it eked out a gain was reason enough for bulls to continue believing in this rally earlier in the week.
At the moment, the index has pulled back to 37,000, but it looks like all signals are pointing to further gains toward Christmas. The Santa rally is on, folks!
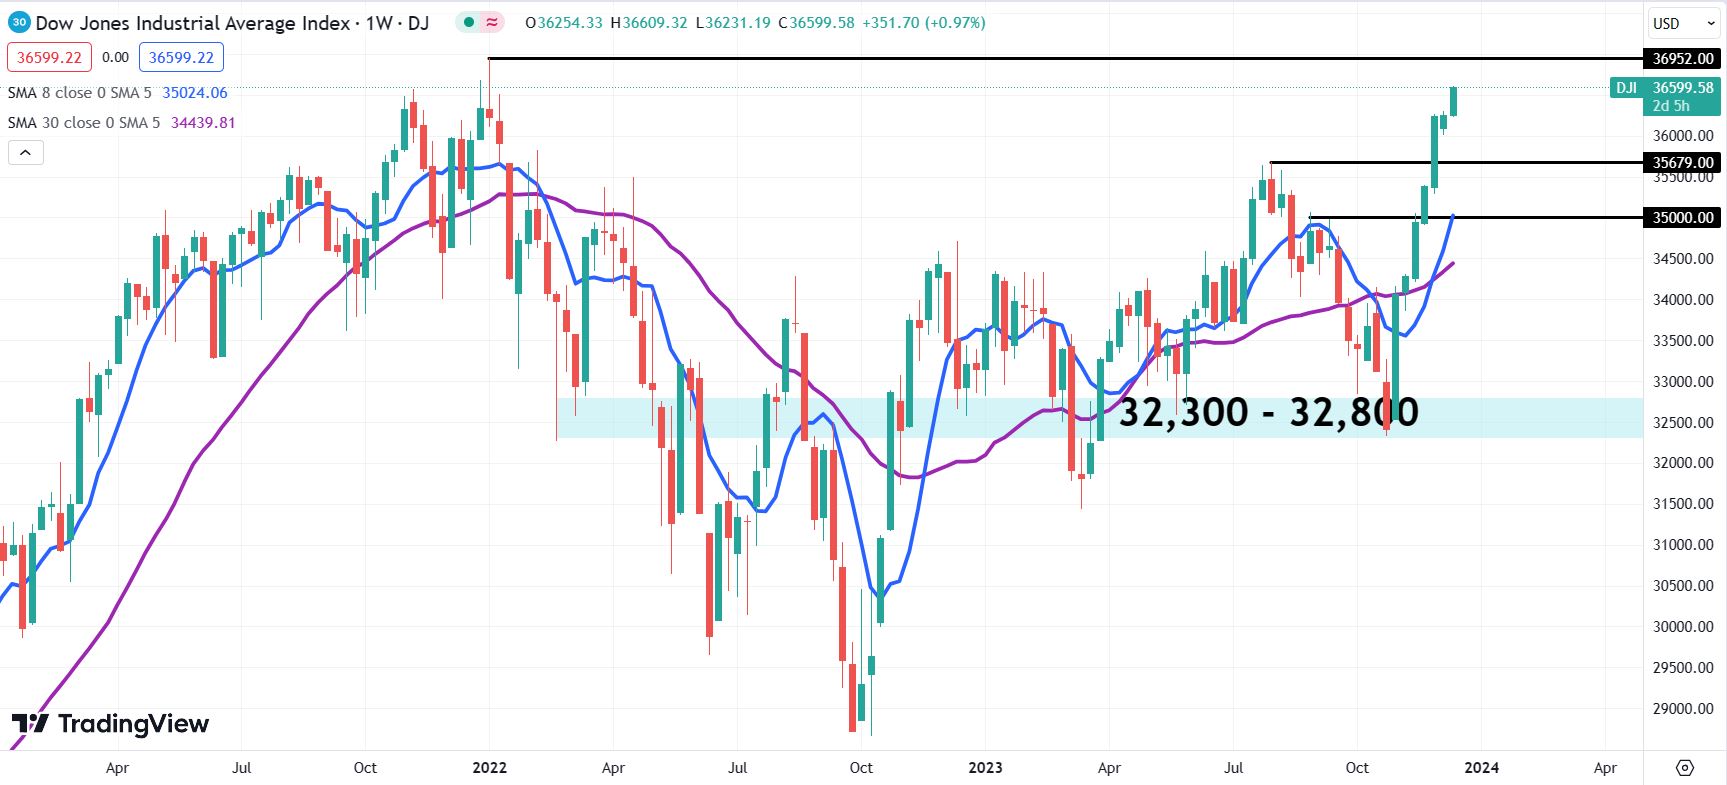
Dow Jones Industrial Average weekly chart
Premium
You have reached your limit of 3 free articles for this month.
Start your subscription and get access to all our original articles.
Author

Clay Webster
FXStreet
Clay Webster grew up in the US outside Buffalo, New York and Lancaster, Pennsylvania. He began investing after college following the 2008 financial crisis.


