Dow Jones Industrial Average trims lower ahead of key CPI inflation print
- The Dow Jones backslid around 200 points on Monday.
- Equities are trimming the topside ahead of a key US CPI inflation print.
- Rising inflation pressures could threaten Fed rate cut expectations.

The Dow Jones Industrial Average (DJIA) fell back on Monday, shedding around 200 points and testing below 44,000 once again as investors brace for the latest United States (US) Consumer Price Index (CPI) inflation figures due on Tuesday. Markets have fully priced in an interest rate cut at the Federal Reserve’s (Fed) next rate call on September 17, but a resurgence of inflationary pressure could put a pin in rate trim hopes.
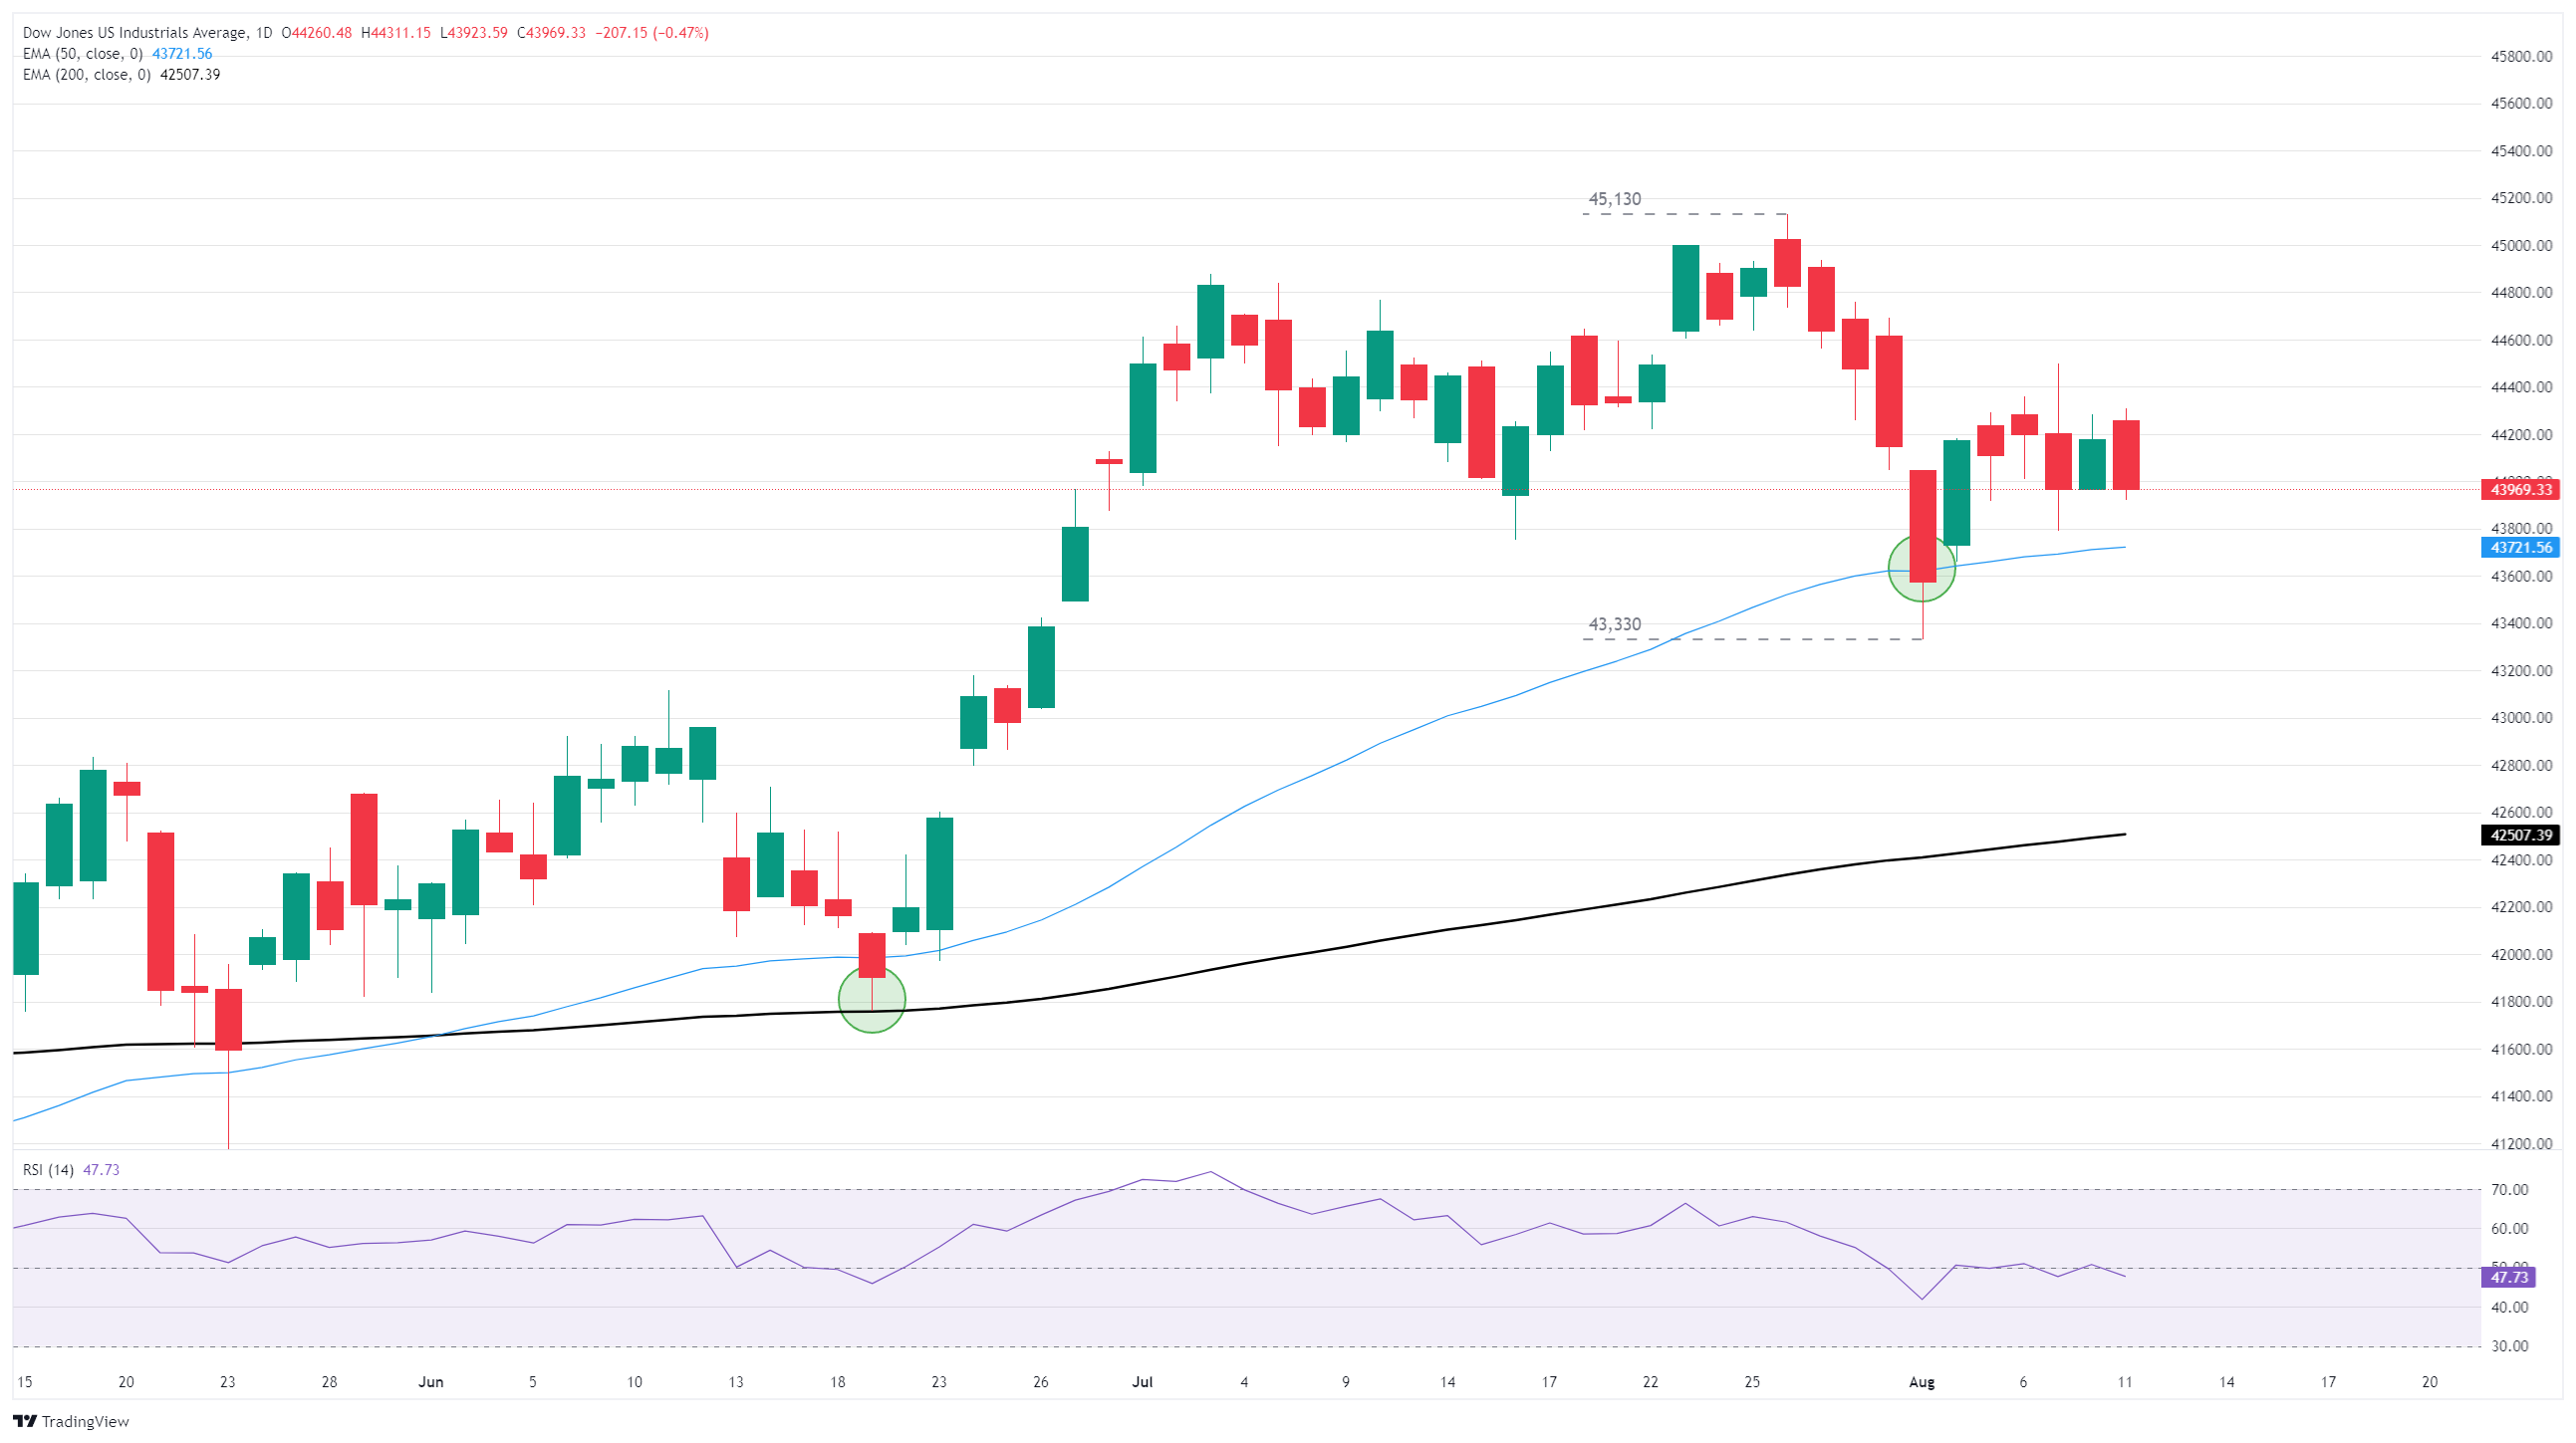
The Dow’s Monday pullback has pushed the major equity index one step closer to a consolidation phase, with the Dow cycling between 44,400 and 43,600 following a technical bounce from the 50-day Exponential Moving Average (EMA) near 43,720. The Dow Jones still remains down about 2.5% from all-time highs posted near 45,130, but the index is planted firmly in bull country north of the 200-day EMA near 42,500.
Fed rate cut hopes could face challenges from rising inflation
According to the CME’s FedWatch Tool, rate traders are pricing in nearly 90% odds of at least a quarter-point rate cut on September 17. However, market hopes for back-to-back rate cuts are still under threat: rate markets are only pricing in around 50% odds of a second interest rate trim on October 29.
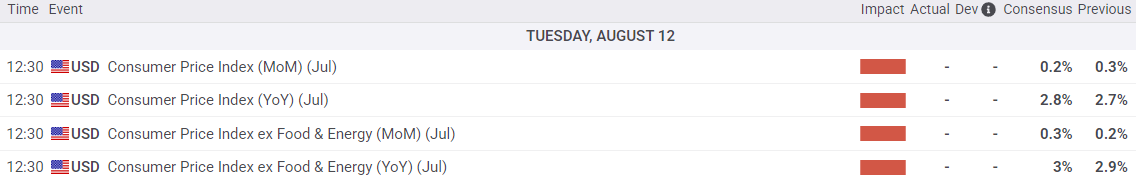
US CPI inflation data from July is due on Tuesday and will draw far more investor attention than usual. Headline and core CPI inflation is expected to tick higher on an annualized basis, and investors will be hoping that an inflation upswing will remain slim enough to not knock the Fed off of its current trajectory on rate cuts. Headline CPI inflation is expected to rise to 2.8% YoY from 2.7%, while core CPI is forecast to tick up to 3.0% YoY from the previous 2.9%.
Read more stock news: Nvidia pushes all-time high as Wells Fargo hikes price target
Dow Jones daily chart
Economic Indicator
Consumer Price Index ex Food & Energy (YoY)
Inflationary or deflationary tendencies are measured by periodically summing the prices of a basket of representative goods and services and presenting the data as the Consumer Price Index (CPI). CPI data is compiled on a monthly basis and released by the US Department of Labor Statistics. The YoY reading compares the prices of goods in the reference month to the same month a year earlier. The CPI Ex Food & Energy excludes the so-called more volatile food and energy components to give a more accurate measurement of price pressures. Generally speaking, a high reading is bullish for the US Dollar (USD), while a low reading is seen as bearish.
Read more.Next release: Tue Aug 12, 2025 12:30
Frequency: Monthly
Consensus: 3%
Previous: 2.9%
Source: US Bureau of Labor Statistics
The US Federal Reserve has a dual mandate of maintaining price stability and maximum employment. According to such mandate, inflation should be at around 2% YoY and has become the weakest pillar of the central bank’s directive ever since the world suffered a pandemic, which extends to these days. Price pressures keep rising amid supply-chain issues and bottlenecks, with the Consumer Price Index (CPI) hanging at multi-decade highs. The Fed has already taken measures to tame inflation and is expected to maintain an aggressive stance in the foreseeable future.
Author

Joshua Gibson
FXStreet
Joshua joins the FXStreet team as an Economics and Finance double major from Vancouver Island University with twelve years' experience as an independent trader focusing on technical analysis.


