Dow Jones Industrial Average crosses 40,000 before settling lower
- Dow Jones clips into a new record high on Thursday.
- Data calendar remains thin, Fedspeak dominates news cycle.
- Despite record bids, Dow Jones gains remain slim.

The Dow Jones Industrial Average (DJIA) pierced the 40,000 major price level on Thursday after equities floated higher early during the US session amidst a thin data calendar. Stock indexes reached fresh all-time highs following a midweek US inflation print showing price growth continues to cool, sparking fresh hope for Federal Reserve (Fed) rate cuts. However, Fedspeak weighed on risk appetite, and stock indexes broadly ended Thursday lower.
Read more: Fed officials still need further conviction regarding inflation
Despite easing headline inflation figures, Fed officials continue to thread the needle on expectations, highlighting the central bank’s neutral stance until data further confirms that current policies are working to ease inflation. Investors are hesitating as Fedspeak weighs on risk sentiment, however rate markets are still pricing in 70% odds of at least a quarter-point cut from the Fed in September according to the CME’s FedWatch Tool.
Dow Jones news
Exactly half of the Dow Jones’ constituent securities ended in the red on Thursday, crimping overall gains for the major equity index. Cisco Systems Inc. (CSCO) fell -2.71% to $48.33 per share as investors pare back over-excitement in the tech company after stellar third-quarter revenue reporting.
On the top side, Walmart Inc. (WMT) soared nearly 7% on Thursday, gaining 4.17 points to hit $64.00 per share at the closing bell. Walmart surged after beating quarterly earnings and revenue forecasts as the commerce giant challenges Amazon as an online retailer after Walmart’s e-commerce sales grew 22% in the US.
Dow Jones technical outlook
The Dow Jones broke north of 40,000.00 on Thursday, reaching a new all-time high of 40,042.54 before investors pulled back midway through the US market session. The DJIA has retreated to the 39,900.00 region, but bidding pressure remains close to the surface.
Despite Thursday’s post-peak hesitation, the DJIA remains firmly bullish, having closed in the green for all but one of the last ten consecutive trading sessions. The Dow Jones is up 6.65% bottom-to-top in 2024, and trading well above the 200-day Exponential Moving Average (EMA) at 37,020.70.
Dow Jones five minute chart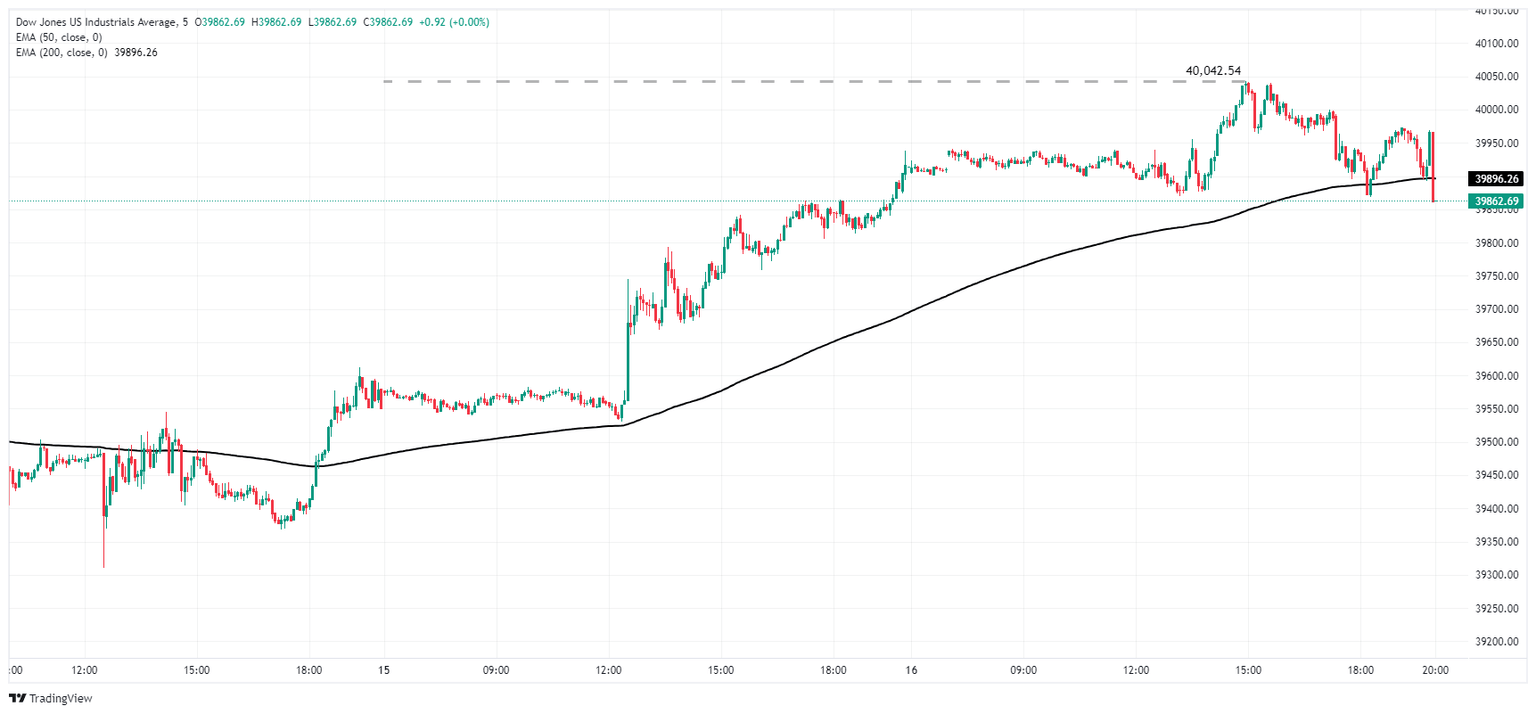
Dow Jones daily chart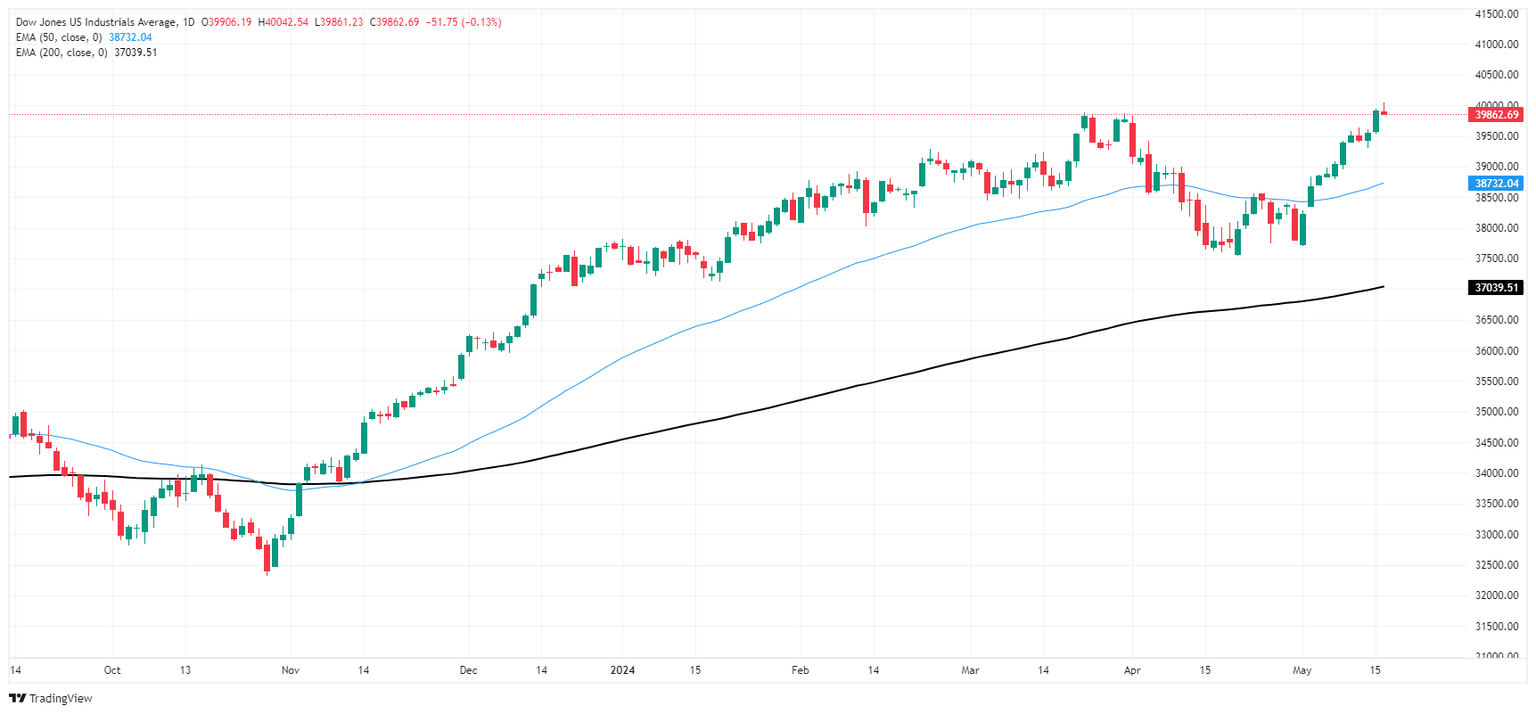
Dow Jones FAQs
The Dow Jones Industrial Average, one of the oldest stock market indices in the world, is compiled of the 30 most traded stocks in the US. The index is price-weighted rather than weighted by capitalization. It is calculated by summing the prices of the constituent stocks and dividing them by a factor, currently 0.152. The index was founded by Charles Dow, who also founded the Wall Street Journal. In later years it has been criticized for not being broadly representative enough because it only tracks 30 conglomerates, unlike broader indices such as the S&P 500.
Many different factors drive the Dow Jones Industrial Average (DJIA). The aggregate performance of the component companies revealed in quarterly company earnings reports is the main one. US and global macroeconomic data also contributes as it impacts on investor sentiment. The level of interest rates, set by the Federal Reserve (Fed), also influences the DJIA as it affects the cost of credit, on which many corporations are heavily reliant. Therefore, inflation can be a major driver as well as other metrics which impact the Fed decisions.
Dow Theory is a method for identifying the primary trend of the stock market developed by Charles Dow. A key step is to compare the direction of the Dow Jones Industrial Average (DJIA) and the Dow Jones Transportation Average (DJTA) and only follow trends where both are moving in the same direction. Volume is a confirmatory criteria. The theory uses elements of peak and trough analysis. Dow’s theory posits three trend phases: accumulation, when smart money starts buying or selling; public participation, when the wider public joins in; and distribution, when the smart money exits.
There are a number of ways to trade the DJIA. One is to use ETFs which allow investors to trade the DJIA as a single security, rather than having to buy shares in all 30 constituent companies. A leading example is the SPDR Dow Jones Industrial Average ETF (DIA). DJIA futures contracts enable traders to speculate on the future value of the index and Options provide the right, but not the obligation, to buy or sell the index at a predetermined price in the future. Mutual funds enable investors to buy a share of a diversified portfolio of DJIA stocks thus providing exposure to the overall index.
Author

Joshua Gibson
FXStreet
Joshua joins the FXStreet team as an Economics and Finance double major from Vancouver Island University with twelve years' experience as an independent trader focusing on technical analysis.


