|

Dow Futures (YM_F): Buying the dips at the blue box area

Hello fellow traders. In this technical article we’re going to take a look at the Elliott Wave charts charts of Dow Jones Futures published in members area of the website.  As our members know YM_F has recently  made pull back that has unfolded as Elliott Wave Zig Zag pattern. It made clear 3 waves down from the February 23rd peak and completed correction right at the Equal Legs zone ( Blue Box -Buying Area) . In further text we’re going to explain the  Elliott Wave pattern  and trading setup.

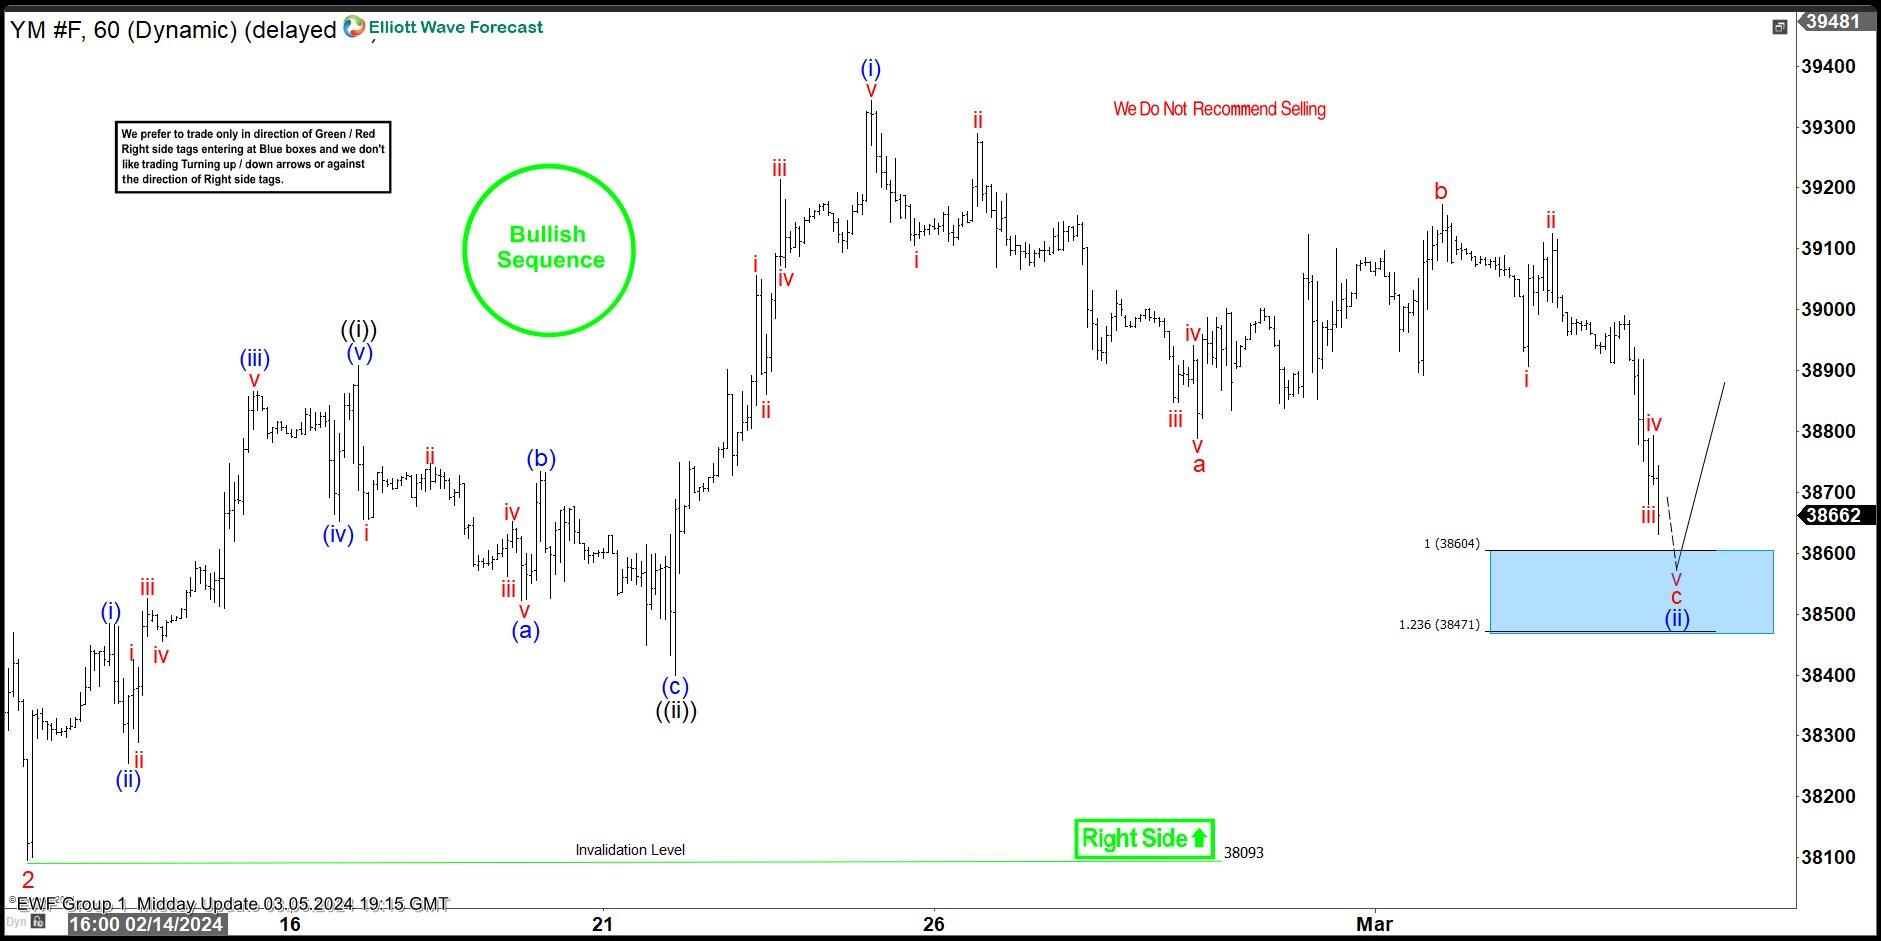
YM_F Elliott Wave one-hour chart 03.05.2024

Dow Jones Futures is showing lower low structure from the peak. Correction has a b c labeling, when we can still be in c red leg. The price structure is incomplete at the moment, calling for a more downside in near term toward : 38604-38471 buying zone. We don’t recommend selling YM_F and prefer the long side from the marked Blue Box ( buying zone). Once Dow Jones reaches our buying area, it should ideally make either rally toward new highs or in 3 waves bounce alternatively. Once bounce reaches 50 Fibs against the b red high, we will make long position risk free ( put SL at BE) and take partial profits.

Quick reminder on how to trade our charts :

Red bearish stamp+ blue box = Selling Setup
Green bullish stamp+ blue box = Buying Setup
Charts with Black stamps are not tradable.

Chart

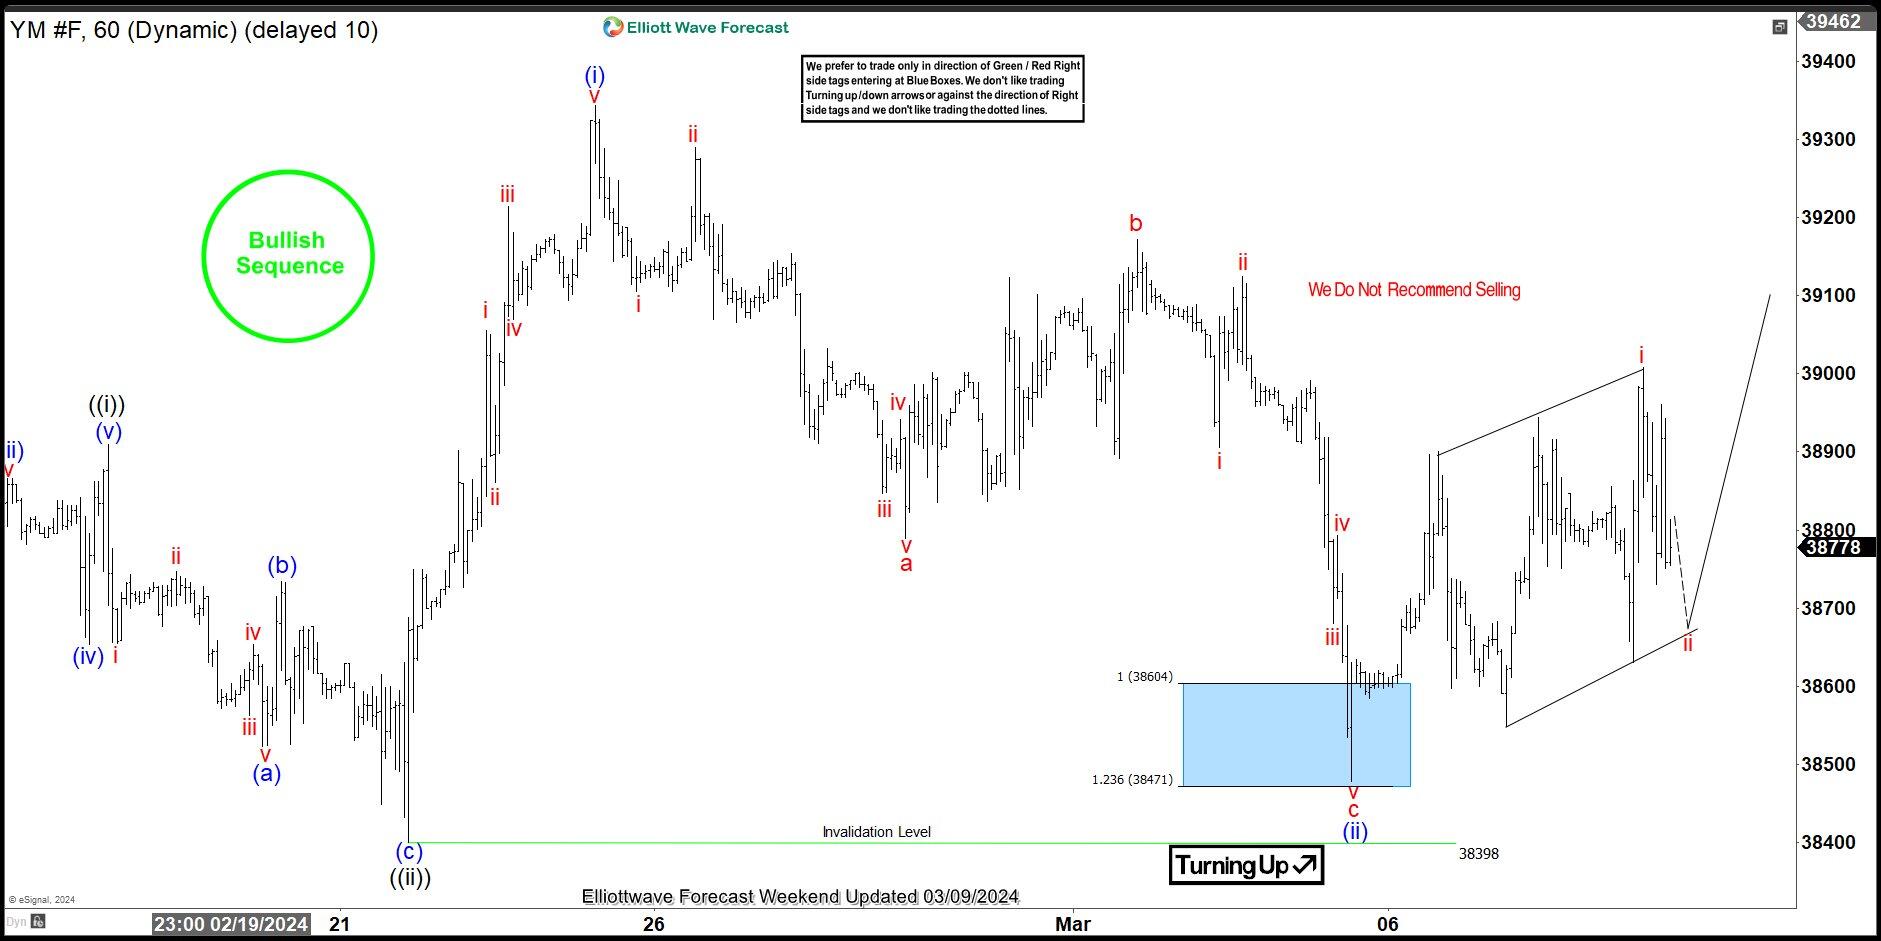
YM_F Elliott Wave one-hour chart 03.09.2024

Dow Jones made extension toward our buying zone at : 38604 – 38471 as we expected. YM_F found buyers at the blue box and we are getting good reaction from there. Consequently, any long positions from the equal legs area should be risk free by now. As far as the price stays above 38473 low, we can see further strength in Dow Jones toward new highs ideally.

Keep in mind that market is dynamic and presented view could have changed in the mean time.  

Chart

Author

Elliott Wave Forecast Team

Elliott Wave Forecast Team

ElliottWave-Forecast.com

More from Elliott Wave Forecast Team
Share:

Markets move fast. We move first.

Orange Juice Newsletter brings you expert driven insights - not headlines. Every day on your inbox.

By subscribing you agree to our Terms and conditions.

Editor's Picks

EUR/USD recovers to 1.1750 region as 2025 draws to a close

Following the bearish action seen in the European session on Wednesday, EUR/USD regains its traction and recovery to the 1.1750 region. Nevertheless, the pair's volatility remains low as trading conditions thin out on the last day of the year.

GBP/USD stays weak near 1.3450 on modest USD recovery

GBP/USD remains under modest beairsh pressure and fluctuates at around 1.3450 on Wednesday. The US Dollar finds fresh demand due to the end-of-the-year position adjustments, weighing on the pair amid the pre-New Year trading lull. 

Gold retreats to $4,300 area, looks to post monthly gains

Gold stays on the back foot on the last day of 2025 and trades near $4,300, possibly pressured by profit-taking and position adjustments. Nevertheless, XAU/USD remains on track to post gains for December and extend its winning streak into a fifth consecutive month.

Bitcoin, Ethereum and XRP prepare for a potential New Year rebound

Bitcoin, Ethereum, and Ripple are holding steady on Wednesday after recording minor gains on the previous day. Technically, Bitcoin could extend gains within a triangle pattern while Ethereum and Ripple face critical overhead resistance. 

Economic outlook 2026-2027 in advanced countries: Solidity test

After a year marked by global economic resilience and ending on a note of optimism, 2026 looks promising and could be a year of solid economic performance. In our baseline scenario, we expect most of the supportive factors at work in 2025 to continue to play a role in 2026.

Crypto market outlook for 2026

Year 2025 was volatile, as crypto often is.  Among positive catalysts were favourable regulatory changes in the U.S., rise of Digital Asset Treasuries (DAT), adoption of AI and tokenization of Real-World-Assets (RWA).