|

Dollar Index Price Analysis: Inverse head-and-shoulders pattern on D1

The dollar index, which tracks the greenback's value against major currencies, has carved out an inverse head-and-shoulders pattern on the daily chart

Tne neckline resistance is currently seen at 90.92. A close higher would confirm a breakout or bearish-to-bullish trend change, creating room for a rally to at least 92.63 (target as per the measured move method). 

On the downside, the low of the right shoulder – 90.045 – is the level to beat for the sellers. 

At press time, the DXY is trading moderately higher on the day near 90.75. 

Daily chart
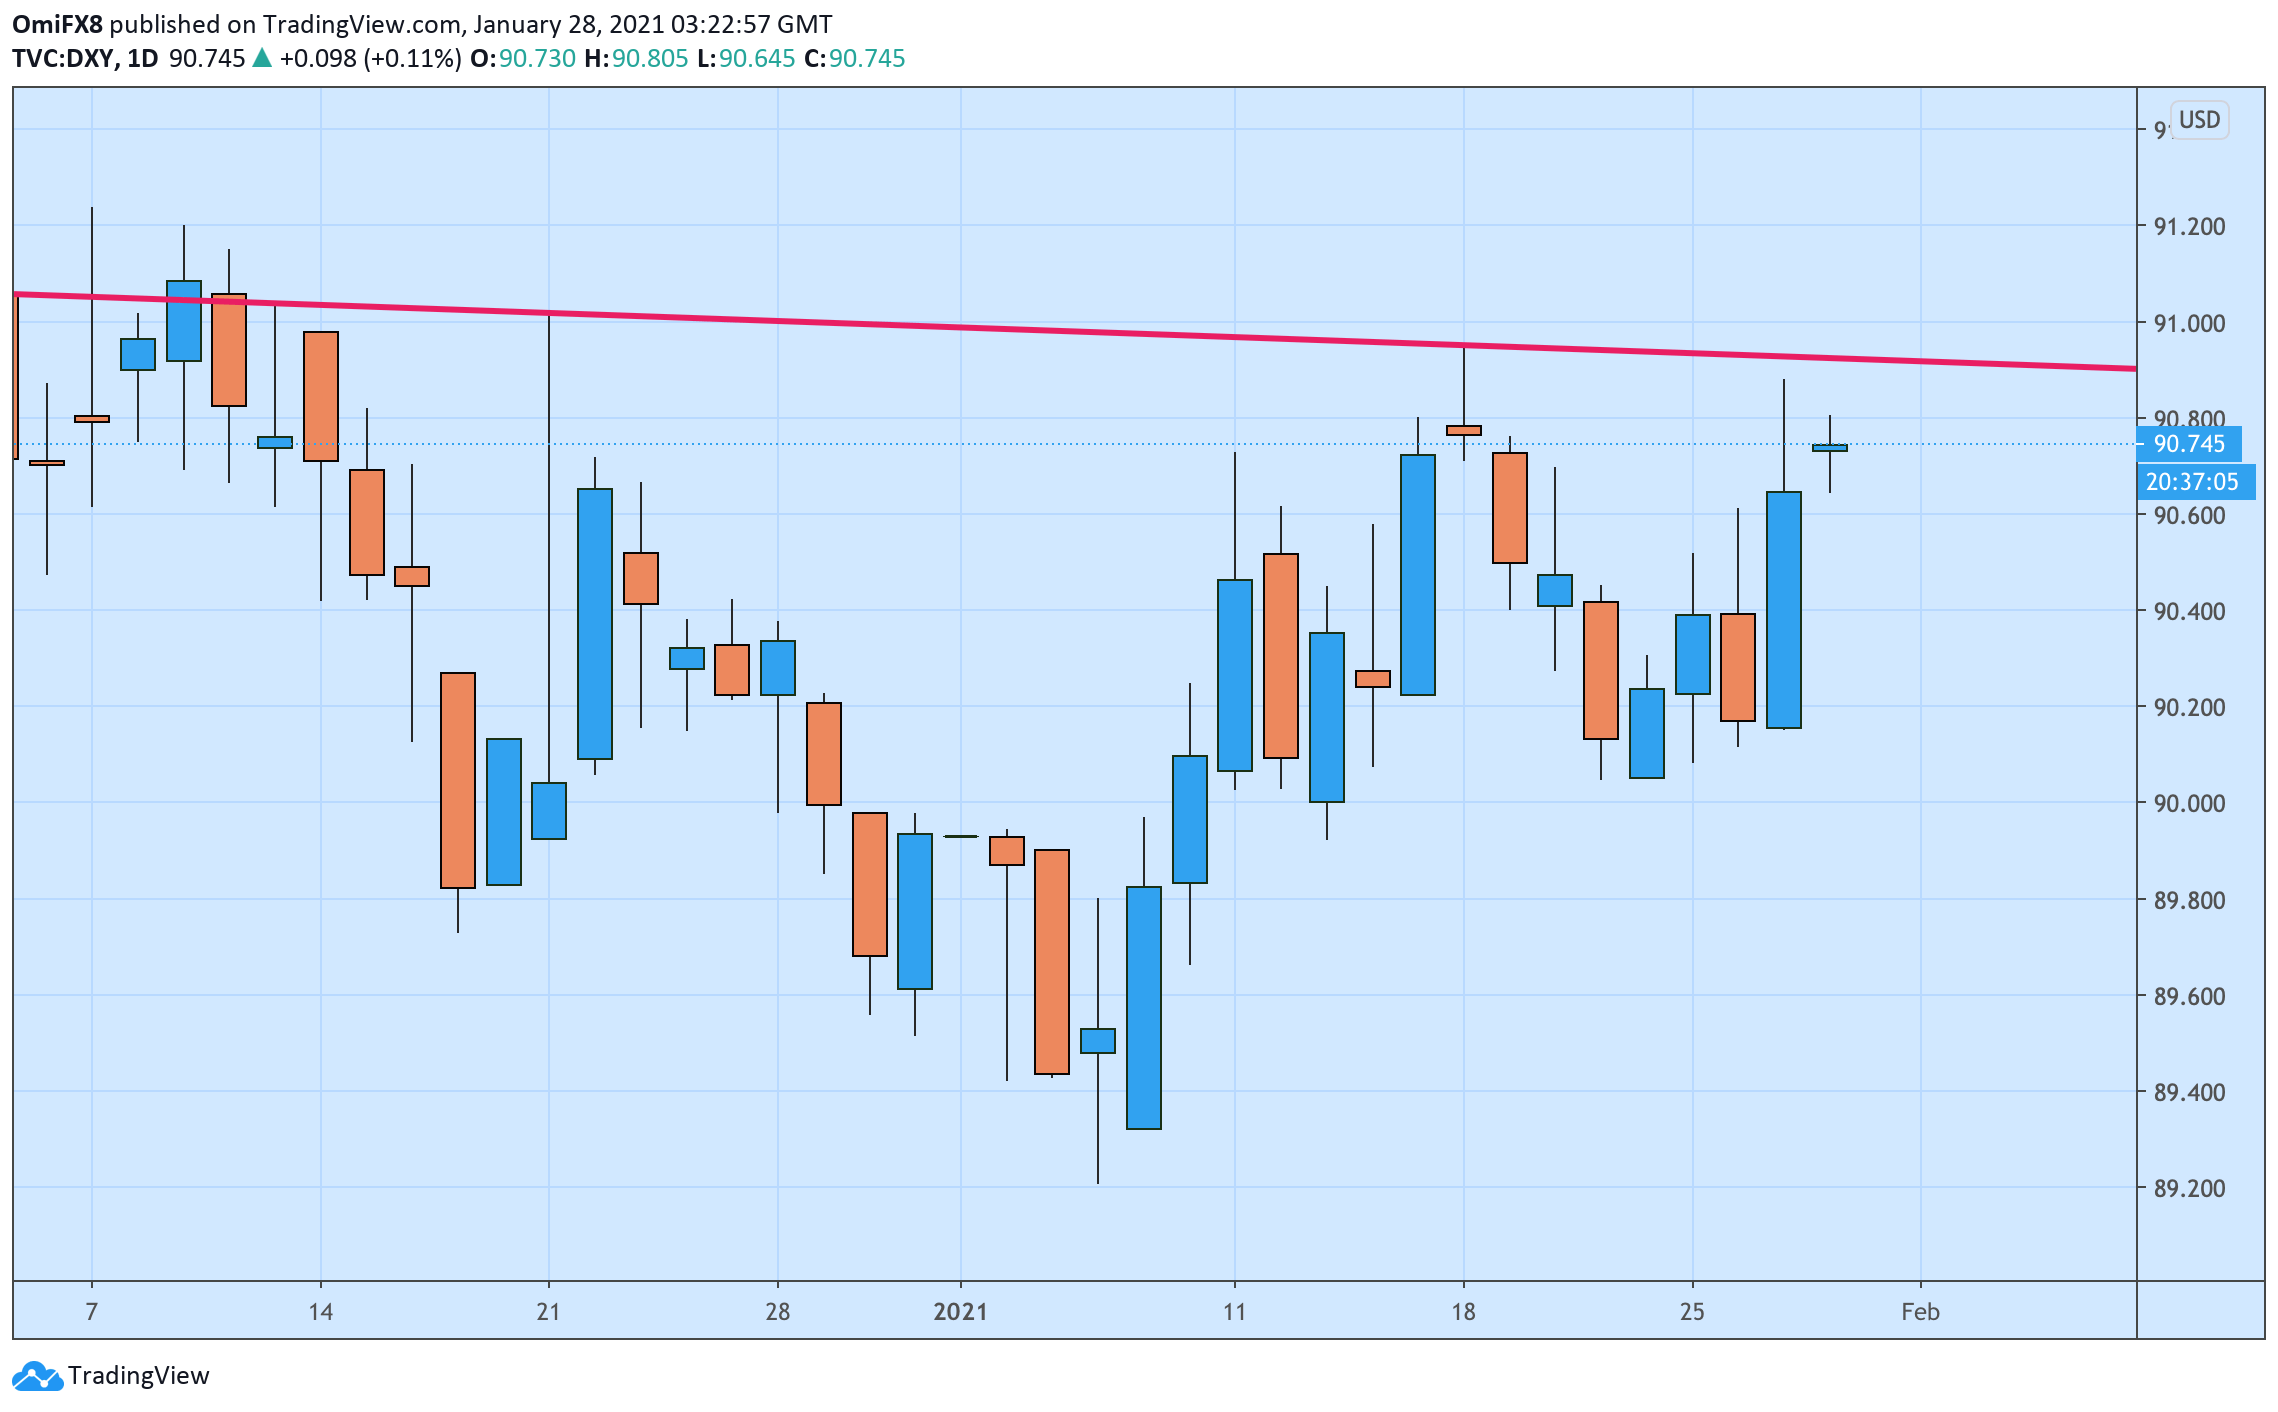
Trend: Bullish above 90.92

Technical levels

Dollar Index Spot

Overview
Today last price90.75
Today Daily Change0.16
Today Daily Change %0.12
Today daily open90.59
 
Trends
Daily SMA2090.18
Daily SMA5090.64
Daily SMA10091.99
Daily SMA20094.14
 
Levels
Previous Daily High90.89
Previous Daily Low90.15
Previous Weekly High90.95
Previous Weekly Low90.05
Previous Monthly High92.02
Previous Monthly Low89.52
Daily Fibonacci 38.2%90.61
Daily Fibonacci 61.8%90.43
Daily Pivot Point S190.2
Daily Pivot Point S289.81
Daily Pivot Point S389.46
Daily Pivot Point R190.94
Daily Pivot Point R291.28
Daily Pivot Point R391.67

Author

Omkar Godbole

Omkar Godbole

FXStreet Contributor

Omkar Godbole, editor and analyst, joined FXStreet after four years as a research analyst at several Indian brokerage companies.

More from Omkar Godbole

Share:

Editor's Picks

GBP/USD drops to multi-week lows below 1.3300

GBP/USD sets aside Friday’s uptick and breaches below the 1.3300 yardstcik on Monday to hit new multi-week troughs. Falling crude oil prices following a pause in the Middle East conflict in combination with the recent soft reading in UK inflation appear to play against any BoE tightening ahead of the bank’s event later in the week.

EUR/USD meets support near 1.1370

EUR/USD fades the initial bull run past 1.1400 the figure, deflating toward the 1.1370 zone on Monday. That said, the pair reverses two daily drops in a row on the back of the irresolute price action in the US Dollar, at the time when investors continue to closely follow developments from the Middle East conflict. Next on tap is the release of the US Consumer Confidence gauge by the Conference Board.

Gold struggles to extend gains beyond $4,100
Spot Gold gapped higher at the beginning of the new week, as a pause in Middle East hostilities underpinned the mood and weighed on the US Dollar (USD). The XAU/USD pair traded as high as $4,116.20 during Asian trading hours, following a pause in strikes between Iran and the United States (US).
Bitcoin vs Gold: BTC and Gold struggle to gain momentum despite US-Iran truce
Market participants are changing gears on Monday from the war between the United States (US) and Iran in the Middle East to the anticipated Federal Reserve (Fed) interest rate decision. Meanwhile, Bitcoin (BTC) and Gold (XAU) are losing momentum, with BTC slipping below the pivotal $65,000 level while XAU remains sideways in the $4,000-$4,100 range.
Pause in military action fails to inspire market rally
More tech volatility has outweighed the impact of the pause in US-Iran fighting, says Chris Beauchamp, Chief Market Analyst at online trading and investing platform IG. When a calming of Middle Eastern hostilities fails to provoke a major up day in stocks, you know there is more trouble ahead.
US Dollar mid-year outlook: Exceptional currency, exceptional risks?
The US Dollar enters the second half of 2026 in a markedly different position from a year ago. The King currency has recovered, reflecting persistent US inflation, changing expectations for Fed policy, geopolitical tensions and renewed demand for defensive assets.