DE Elliott Wave technical analysis [Video]
![DE Elliott Wave technical analysis [Video]](https://editorial.fxstreet.com/images/Markets/Equities/Industries/CommercialServices/business-woman-client-637435343342689385_XtraLarge.jpg)
DE Elliott Wave Analysis Trading Lounge.
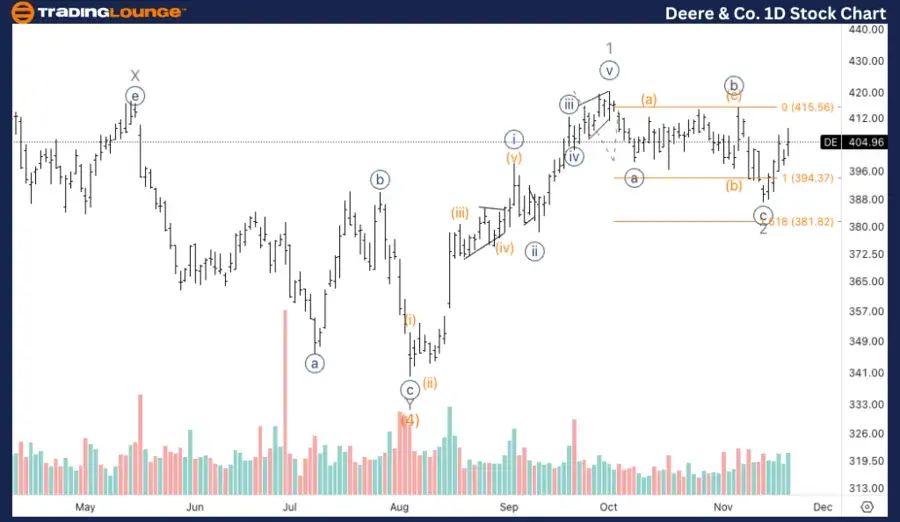
Deere&Co., (DE) Daily Chart.
DE Elliott Wave technical analysis
Function: Trend.
Mode: Impulsive.
Structure: Motive.
Position: Wave {i} of 3.
Direction: Upside into wave 3.
Details: Looking at the possibility of a bottom in wave 2 after we reached equality of {c} vs. {a}, and volume seems to be suggesting the bullish case as well.
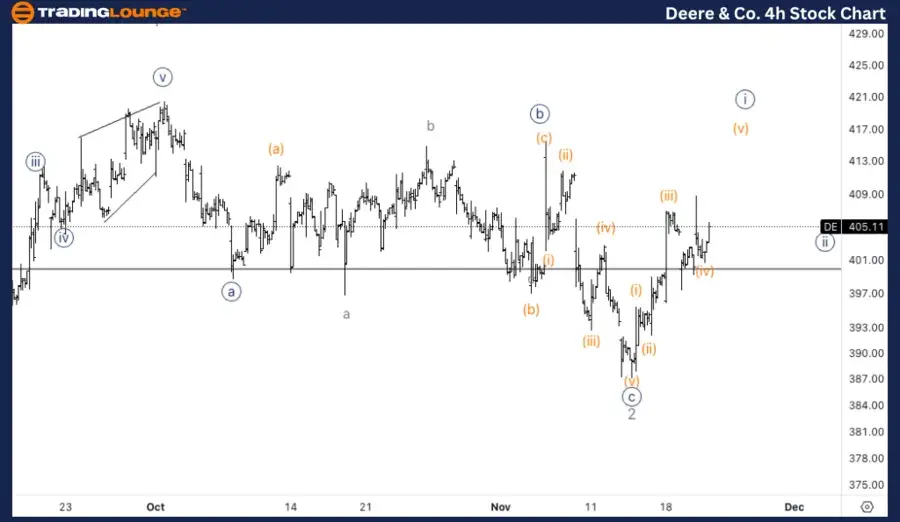
Deere&Co., (DE) 1H Chart.
DE Elliott Wave technical analysis
Function: Trend.
Mode: Impulsive.
Structure: Motive.
Position: Wave (v) of {i}.
Direction: Upside in wave (v).
Details: Looking for some sort of a triangle in wave (iv) to then accelerate higher into wave (v) and complete minute wave {i}.
This Elliott Wave analysis of Deere&Co., (DE) outlines both the daily and 1-hour chart structures, highlighting the current trends and possible future price movements.
DE Elliott Wave technical analysis – Daily chart
Deere & Co. (DE) appears to have found a bottom in wave 2, following the equality of wave {c} versus wave {a}. This could signal the beginning of wave {i} of 3 to the upside, with volume supporting a potential shift toward a bullish structure. If confirmed, this wave 3 typically marks a strong impulsive move, suggesting further upward momentum.
DE Elliott Wave technical analysis – One-hour chart
On the 1-hour chart, DE seems to be forming a triangle in wave (iv), which is a common corrective pattern before a final push higher. Once this triangle completes, we expect wave (v) to accelerate upward, completing minute wave {i} of the larger impulsive structure. The upcoming breakout of the triangle could provide the next bullish leg.
Technical analyst: Alessio Barretta.
DE Elliott Wave technical analysis [Video]
Author

Peter Mathers
TradingLounge
Peter Mathers started actively trading in 1982. He began his career at Hoei and Shoin, a Japanese futures trading company.


