|

DAX is declining in an impulsive structure [Video]

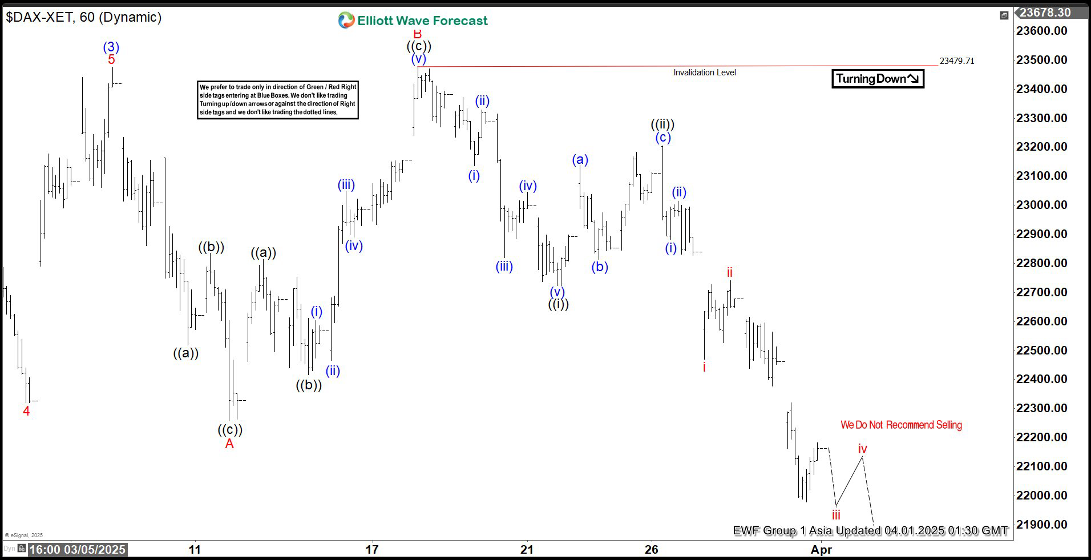
The $DAX appears to be tracing a five-wave impulsive decline from its recent high on March 18, 2025. In Elliott Wave theory, an impulsive structure consists of five distinct waves. Wave 1, 2, 3, 4, and 5 as motive wave moves the direction of the prevailing trend, which in this case is downward. This pattern indicates a strong, directional move, with waves ((i)), ((iii)), and ((v)) being motive (driving the decline) and waves ((ii)) and ((iv)) serving as countertrend corrections.

Starting from the March 18 peak, wave ((i)) likely initiated the downturn which ended at 22723.19. It was followed by a corrective wave ((ii))  rebound towards 23204.59. Wave ((iii)), typically the longest and most powerful in an impulsive sequence, should push the index lower with momentum. A smaller corrective wave ((iv)) is then expected to follow, offering a brief bounce. Then wave ((v)) should complete the structure, potentially finding a bottom. The impulsive nature suggests that each motive wave ((i)), ((iii)), ((v))) subdivides into its own five-wave pattern, reinforcing the bearish outlook.

Key levels to watch include support zones where prior corrections have held. Exact targets however depend on the unfolding wave lengths and Fibonacci relationships. Expect further downside until the fifth wave concludes. Afterwards, a larger corrective rally could emerge. This view aligns with sentiment for a continued near-term decline in the $DAX, driven by an impulsive bearish sequence.

DAX 60 minutes Elliott Wave chart

DAX Elliott Wave [Video]

Author

Elliott Wave Forecast Team

Elliott Wave Forecast Team

ElliottWave-Forecast.com

More from Elliott Wave Forecast Team
Share:

Markets move fast. We move first.

Orange Juice Newsletter brings you expert driven insights - not headlines. Every day on your inbox.

By subscribing you agree to our Terms and conditions.

Editor's Picks

EUR/USD trades with negative bias around 1.1730 amid recovering USD; downside seems limited

The EUR/USD pair kicks off the new week on a softer note, though it remains within striking distance of the highest level since early October, touched last Thursday. Spot prices currently trade around the 1.1730 region, down less than 0.10% for the day.

GBP/USD holds steady above mid-1.3300s as traders await key data and BoE this week

The GBP/USD pair remains on the defensive during the Asian session on Monday, though it lacks bearish conviction and holds above the 200-day Simple Moving Average pivotal support. Spot prices currently trade around the 1.3360 region, nearly unchanged for the day.

Gold retains bullish bias ahead of this week’s key US macro releases

Gold attracts buyers for the fifth straight day and climbs to the $4,330 region during the Asian session on Monday. The commodity remains well within striking distance of its highest level since October 21, touched on Friday, and seems poised to appreciate further amid a supportive fundamental backdrop. 

Solana consolidates as spot ETF inflows near $1 billion signal institutional dip-buying

Solana price hovers above $131 at the time of writing on Monday, nearing the upper boundary of a falling wedge pattern, awaiting a decisive breakout. On the institutional side, demand for spot Solana Exchange-Traded Funds remained firm, pushing total assets under management to nearly $1 billion since launch. 

Big week ends with big doubts

The S&P 500 continued to push higher yesterday as the US 2-year yield wavered around the 3.50% mark following a Federal Reserve (Fed) rate cut earlier this week that was ultimately perceived as not that hawkish after all. The cut is especially boosting the non-tech pockets of the market.

Solana Price Forecast: SOL consolidates as spot ETF inflows near $1 billion signal institutional dip-buying

Solana (SOL) price hovers above $131 at the time of writing on Monday, nearing the upper boundary of a falling wedge pattern, awaiting a decisive breakout.