DAX (Germany) Index Elliott Wave technical analysis [Video]
![DAX (Germany) Index Elliott Wave technical analysis [Video]](https://editorial.fxsstatic.com/images/i/Equity-Index_DAX-2.jpg)
DAX (Germany) Elliott Wave analysis – Day chart
DAX (Germany) Wave technical review
Function: Counter Trend.
Mode: Corrective.
Structure: Orange Wave 2.
Position: Navy Blue Wave 1.
Direction next higher degrees: Orange Wave 3.
Details: Orange Wave 1 appears completed. Orange Wave 2 is currently unfolding.
Invalidation level: 18530.
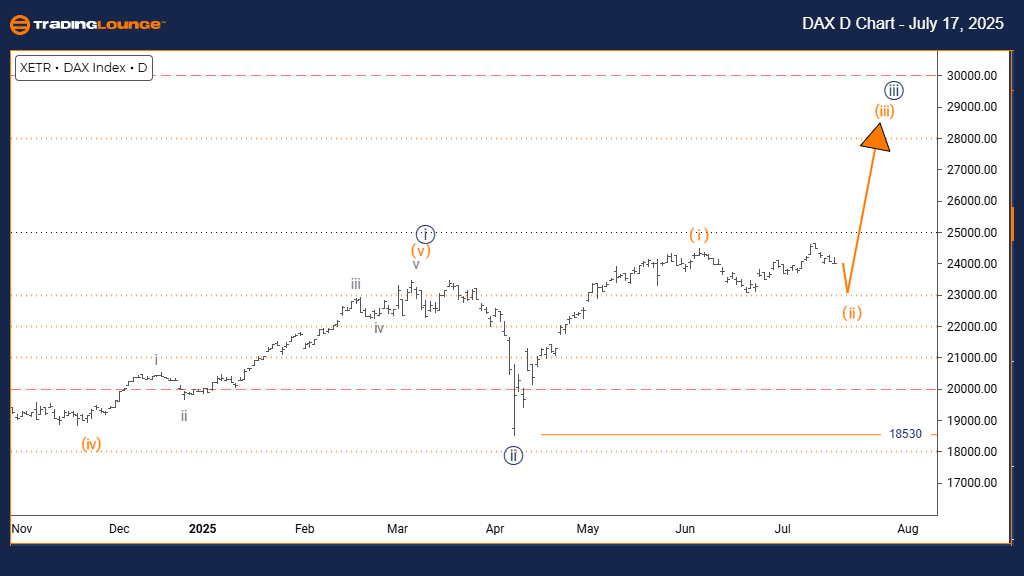
The daily Elliott Wave analysis of the DAX index indicates a counter-trend corrective phase. Orange Wave 2 is in progress following the completion of Orange Wave 1. This development occurs within a broader Navy Blue Wave 1 structure, suggesting a temporary retracement phase against the primary bullish trend.
The current price behavior is typical of corrections, showing decreased momentum and possible sideways movement. Orange Wave 2 represents a likely pause before Orange Wave 3 begins its advance. The critical invalidation point at 18530 serves as a key reference level; if breached, the current wave structure would be invalidated.
This setup implies the DAX may be forming a short-term low, providing a framework for entry opportunities in anticipation of the next upward move. Traders are advised to monitor signs of wave completion, which could signal the start of Orange Wave 3. The correction is expected to be limited in scope, representing a pause rather than a reversal.
The daily perspective emphasizes the temporary nature of this phase. Price action near the 18530 level will help validate or invalidate the current analysis. This Elliott Wave model gives traders a structured approach to anticipating future trend resumption.
DAX (Germany) Elliott Wave analysis – Weekly chart
Function: Bullish Trendl
Mode: Impulsivel
Structure: Navy Blue Wave 3l
Position: Gray Wave 3l
Direction next lower degrees: Navy Blue Wave 4l
Details: Navy Blue Wave 2 appears completed. Navy Blue Wave 3 of 3 is in progress.
Invalidation level: 18530.
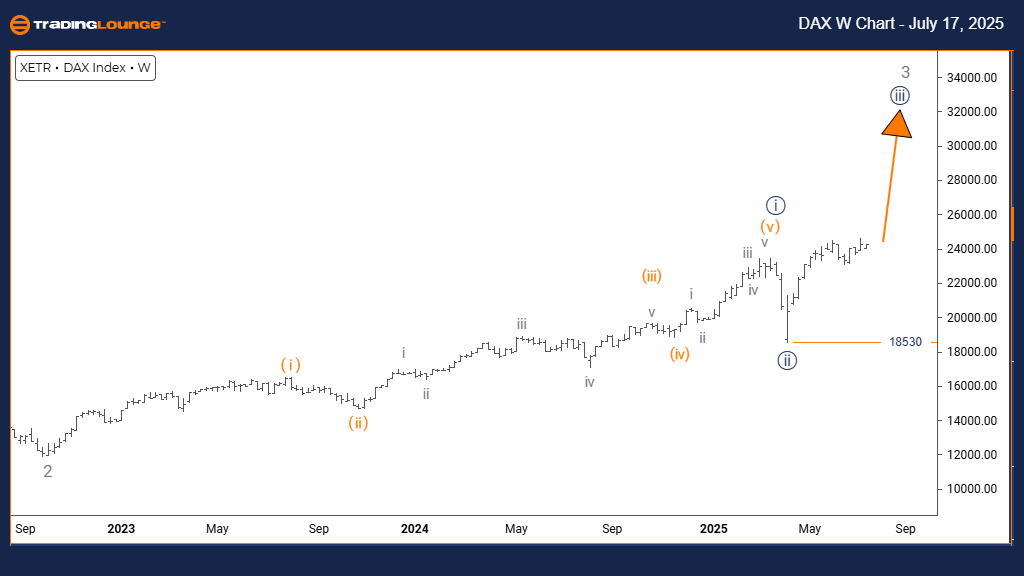
The weekly Elliott Wave analysis of the DAX index confirms a strong bullish trend with impulsive momentum. Navy Blue Wave 3 is forming within a broader Gray Wave 3 context. This stage often generates powerful upward moves in well-established trends.
The conclusion of Navy Blue Wave 2 marks the beginning of Navy Blue Wave 3, typically the most dynamic segment of the Elliott Wave sequence. This phase often brings strong institutional buying and widespread market participation. The invalidation level remains at 18530, acting as a technical safeguard.
This chart setup shows the DAX firmly in a bullish cycle. The current wave structure suggests that the trend has substantial room to extend before any significant resistance appears. Momentum is expected to continue supporting higher prices, reinforcing the wave interpretation.
Traders can align their strategies with this advancing structure while managing risk via the 18530 threshold. The current wave likely offers high-probability opportunities during minor pullbacks. Volume and price behavior during Wave 3 often confirm strong underlying demand.
DAX (Germany) Index Elliott Wave technical analysis [Video]
Author

Peter Mathers
TradingLounge
Peter Mathers started actively trading in 1982. He began his career at Hoei and Shoin, a Japanese futures trading company.


