|

Silver Price Analysis: XAG/USD struggles to find acceptance above 100-day SMA

  • Silver climbs to a one-week high on Wednesday, albeit lacks follow-through.
  • The technical setup warrants some caution before placing fresh bullish bets.
  • A sustained move beyond the $23.70-75 area would negate the bearish bias.

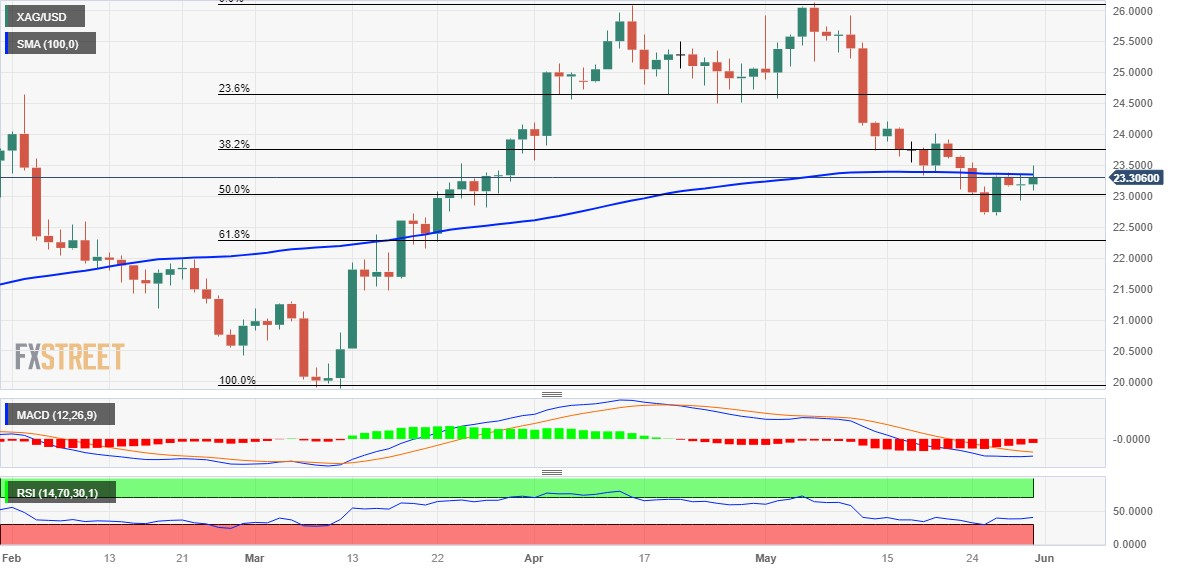
Silver attracts fresh buying following the previous day's two-way price moves and climbs to a one-week high, around the $23.50 area on Wednesday. The white metal, however, struggles to capitalize on the move or find acceptance above the 100-day Simple Moving Average (SMA) and retreats to the $23.30 region during the early North American session.

Oscillators on the daily chart, meanwhile, have been recovering from lower levels, though are still holding in the negative territory. Hence, any subsequent move up is more likely to confront stiff resistance near the $23.70-$23.75 area, or the 38.2% Fibonacci retracement level of the March-May rally. A sustained strength beyond the said barrier will suggest that the recent pullback from over a one-year high has run its course and shift the bias in favour of bullish traders.

The XAG/USD might then surpass the $24.00 round-figure mark and accelerate the momentum towards the next relevant hurdle near the $24.20-$24.25 region en route to the $24.50-$24.60 strong horizontal support breakpoint. The latter coincides with the 23.6% Fibo. level, above which a fresh bout of a short-covering should allow bullish traders to reclaim the $25.00 psychological mark. The upward trajectory could get extended towards the $25.30-$25.35 supply zone.

On the flip side, the 50% Fibo. level, just below the $23.00 round figure, now seems to protect the immediate downside ahead of the monthly low, around the $22.70-$22.65 region. Some follow-through selling will be seen as a fresh trigger for bearish traders and drag the XAG/USD below the 61.8% Fibo. level, around the $22.25 region, towards the $22.00 mark.

Silver daily chart

fxsoriginal

Key levels to watch

XAG/USD

Overview
Today last price23.37
Today Daily Change0.18
Today Daily Change %0.78
Today daily open23.19
 
Trends
Daily SMA2024.18
Daily SMA5024.4
Daily SMA10023.35
Daily SMA20022.06
 
Levels
Previous Daily High23.34
Previous Daily Low22.93
Previous Weekly High23.92
Previous Weekly Low22.68
Previous Monthly High26.09
Previous Monthly Low23.57
Daily Fibonacci 38.2%23.19
Daily Fibonacci 61.8%23.09
Daily Pivot Point S122.97
Daily Pivot Point S222.74
Daily Pivot Point S322.55
Daily Pivot Point R123.38
Daily Pivot Point R223.57
Daily Pivot Point R323.8

Author

Haresh Menghani

Haresh Menghani is a detail-oriented professional with 10+ years of extensive experience in analysing the global financial markets.

More from Haresh Menghani
Share:

Markets move fast. We move first.

Orange Juice Newsletter brings you expert driven insights - not headlines. Every day on your inbox.

By subscribing you agree to our Terms and conditions.

Editor's Picks

EUR/USD clings to small gains near 1.1750

Following a short-lasting correction in the early European session, EUR/USD regains its traction and clings to moderate gains at around 1.1750 on Monday. Nevertheless, the pair's volatility remains low, with investors awaiting this weeks key data releases from the US and the ECB policy announcements.

GBP/USD edges higher toward 1.3400 ahead of US data and BoE

GBP/USD reverses its direction and advances toward 1.3400 following a drop to the 1.3350 area earlier in the day. The US Dollar struggles to gather recovery momentum as markets await Tuesday's Nonfarm Payrolls data, while the Pound Sterling holds steady ahead of the BoE policy announcements later in the week.

Gold pulls away from session high, holds above $4,300

Gold loses its bullish momentum and retreats below $4,330 after testing $4,350 on Monday. XAU/USD, however, stays in positive territory as the US Dollar remains on the back foot on growing expectations for a dovish Fed policy outlook next year.

Solana consolidates as spot ETF inflows near $1 billion signal institutional dip-buying

Solana price hovers above $131 at the time of writing on Monday, nearing the upper boundary of a falling wedge pattern, awaiting a decisive breakout. On the institutional side, demand for spot Solana Exchange-Traded Funds remained firm, pushing total assets under management to nearly $1 billion since launch. 

Big week ends with big doubts

The S&P 500 continued to push higher yesterday as the US 2-year yield wavered around the 3.50% mark following a Federal Reserve (Fed) rate cut earlier this week that was ultimately perceived as not that hawkish after all. The cut is especially boosting the non-tech pockets of the market.

Solana Price Forecast: SOL consolidates as spot ETF inflows near $1 billion signal institutional dip-buying

Solana (SOL) price hovers above $131 at the time of writing on Monday, nearing the upper boundary of a falling wedge pattern, awaiting a decisive breakout.