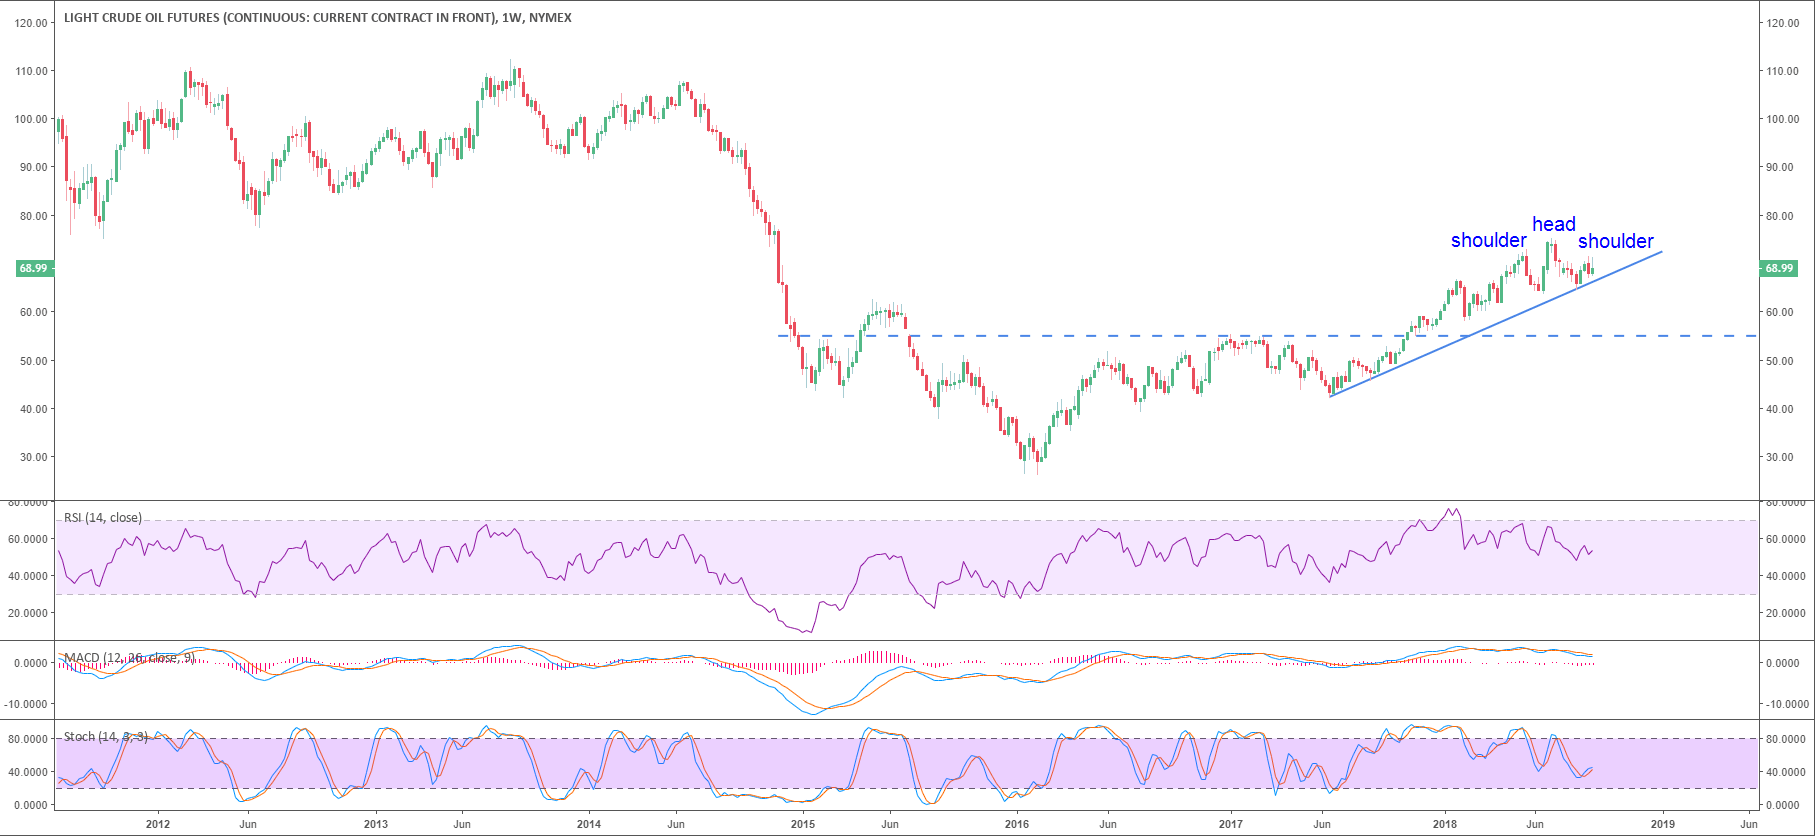
Crude Oil WTI Technical Analysis: Weekly Head-and-Shoulders pattern can send Black Gold down to $55.00 a barrel


  • Crude oil is trading in a bull trend on the weekly chart. 
  • However, crude oil formed a head-and-shoulders pattern which can potentially send oil back to $55.00 a barrel which was the last key support/resistance level. 
  • The RSI and MACD indicators are also decelerating suggesting a loss of bullish momentum. 

Crude oil WTI weekly chart

Spot rate:                  68.95
Relative change:       0.26%     
High:                         69.88
Low:                          67.92

Main Trend:               Bullish 
Short-term trend:      Bearish

Resistance 1:           69.00 figure.
Resistance 2:           69.30 August 24 high 
Resistance 3:           69.44 June 25 high
Resistance 4:           70.00 figure
Resistance 5:           70.53 May 24 low
Resistance 6:           71.41 September 4 high 

Support 1:                68.00-68.30 zone, figure and supply/demand level
Support 2:                67.84 August 14 swing high
Support 3:                67.16 June 14 high
Support 4:                67.72 June 26 low 
Support 5:                66.85 August 9 low

Share: Feed news

Note: All information on this page is subject to change. The use of this website constitutes acceptance of our user agreement. Please read our privacy policy and legal disclaimer. Opinions expressed at FXstreet.com are those of the individual authors and do not necessarily represent the opinion of FXstreet.com or its management. Risk Disclosure: Trading foreign exchange on margin carries a high level of risk, and may not be suitable for all investors. The high degree of leverage can work against you as well as for you. Before deciding to invest in foreign exchange you should carefully consider your investment objectives, level of experience, and risk appetite. The possibility exists that you could sustain a loss of some or all of your initial investment and therefore you should not invest money that you cannot afford to lose. You should be aware of all the risks associated with foreign exchange trading, and seek advice from an independent financial advisor if you have any doubts.

Recommended content


Recommended content

Editors’ Picks

EUR/USD regains traction, recovers above 1.0700

EUR/USD regains traction, recovers above 1.0700

EUR/USD regained its traction and turned positive on the day above 1.0700 in the American session. The US Dollar struggles to preserve its strength after the data from the US showed that the economy grew at a softer pace than expected in Q1.

EUR/USD News

GBP/USD returns to 1.2500 area in volatile session

GBP/USD returns to 1.2500 area in volatile session

GBP/USD reversed its direction and recovered to 1.2500 after falling to the 1.2450 area earlier in the day. Although markets remain risk-averse, the US Dollar struggles to find demand following the disappointing GDP data.

GBP/USD News

Gold climbs above $2,340 following earlier drop

Gold climbs above $2,340 following earlier drop

Gold fell below $2,320 in the early American session as US yields shot higher after the data showed a significant increase in the US GDP price deflator in Q1. With safe-haven flows dominating the markets, however, XAU/USD reversed its direction and rose above $2,340.

Gold News

XRP extends its decline, crypto experts comment on Ripple stablecoin and benefits for XRP Ledger

XRP extends its decline, crypto experts comment on Ripple stablecoin and benefits for XRP Ledger

Ripple extends decline to $0.52 on Thursday, wipes out weekly gains. Crypto expert asks Ripple CTO how the stablecoin will benefit the XRP Ledger and native token XRP. 

Read more

After the US close, it’s the Tokyo CPI

After the US close, it’s the Tokyo CPI

After the US close, it’s the Tokyo CPI, a reliable indicator of the national number and then the BoJ policy announcement. Tokyo CPI ex food and energy in Japan was a rise to 2.90% in March from 2.50%.

Read more

Forex MAJORS

Cryptocurrencies

Signatures