- Crude oil is challenging highs not seen since mid-July as the bulls are busy trying to re-establish the main bull trend.
- However, the market is evolving in a rising wedge fashion signaling that this might be a crowded trade. If bears start to rotate lower below 70.00 it can induce bulls to take profits and new bears entering the market at this key level. Target to the downside is located near 68.00-68.30 zone (figure and supply/demand level).
- A sustained breakout above 70.00 would invalidate the bearish bias.
Crude oil WTI 480-minute chart
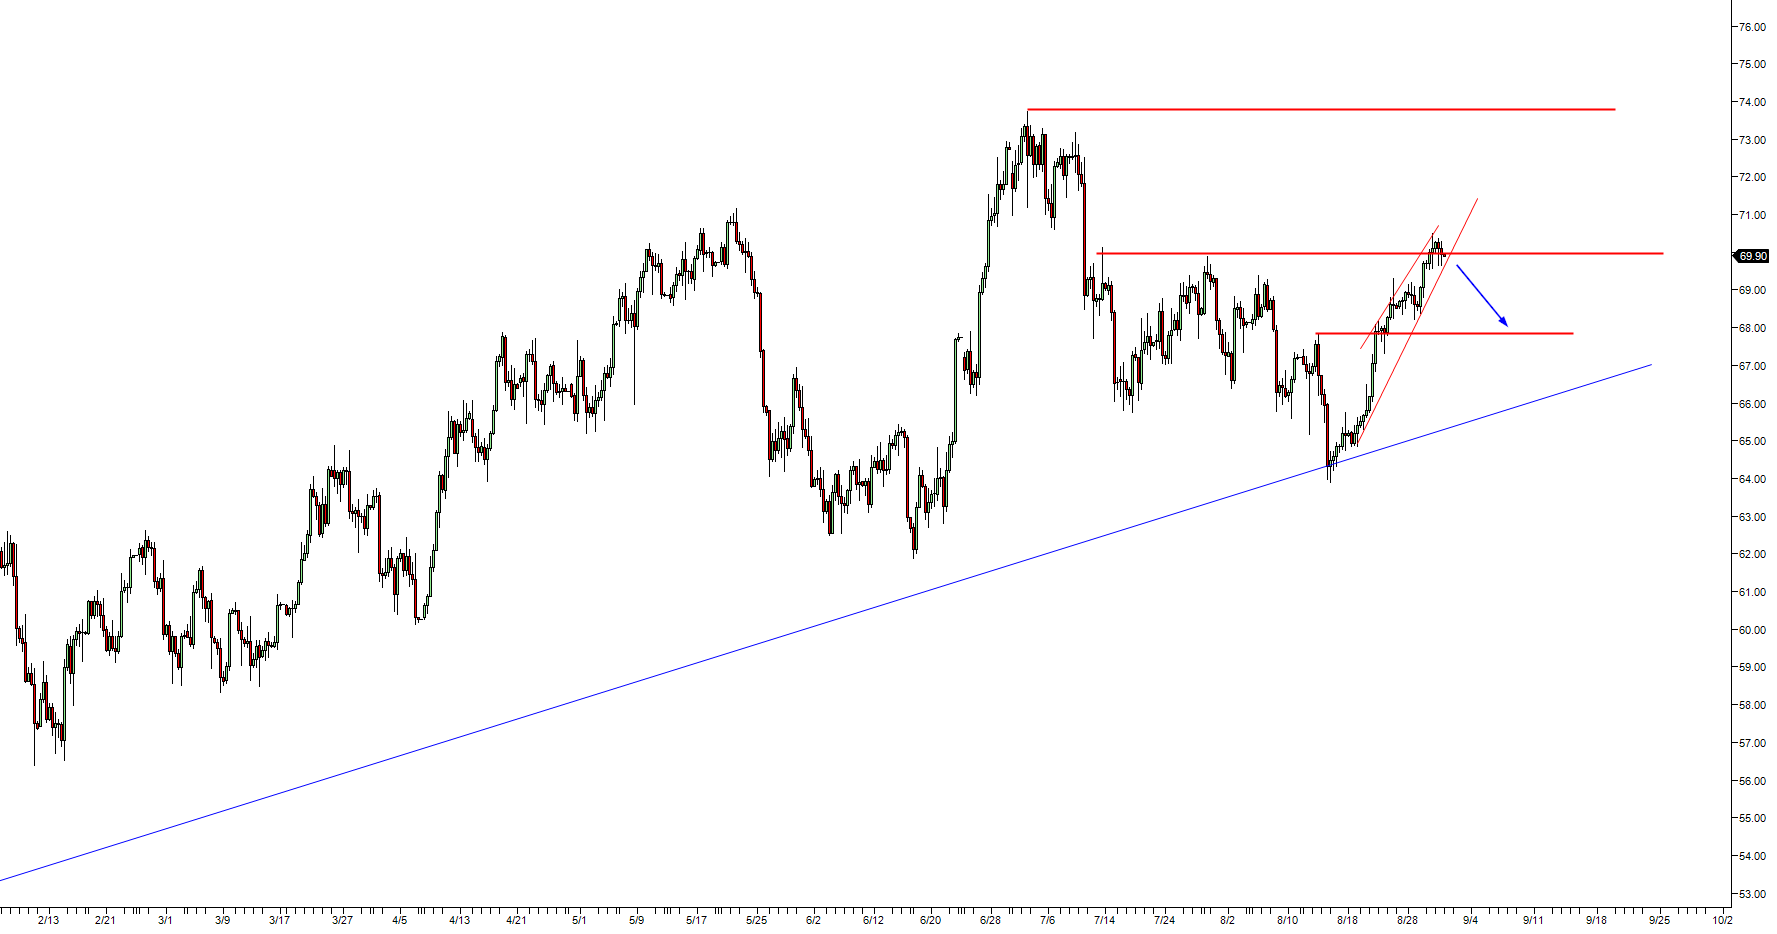
Spot rate: 69.88
Relative change: -0.20%
High: 70.34
Low: 69.62
Main Trend: Bullish
Short-term trend: Bearish below 70.00
Resistance 1: 70.00 figure
Resistance 2: 70.53 May 24 low
Resistance 3: 71.19 May 23 low
Resistance 4: 72.13 July 6 low
Support 1: 69.44 June 25 high
Support 2: 69.30 August 24 high
Support 3: 69.00 figure
Support 4: 68.00-68.30 zone, figure and supply/demand level
Note: All information on this page is subject to change. The use of this website constitutes acceptance of our user agreement. Please read our privacy policy and legal disclaimer. Opinions expressed at FXstreet.com are those of the individual authors and do not necessarily represent the opinion of FXstreet.com or its management. Risk Disclosure: Trading foreign exchange on margin carries a high level of risk, and may not be suitable for all investors. The high degree of leverage can work against you as well as for you. Before deciding to invest in foreign exchange you should carefully consider your investment objectives, level of experience, and risk appetite. The possibility exists that you could sustain a loss of some or all of your initial investment and therefore you should not invest money that you cannot afford to lose. You should be aware of all the risks associated with foreign exchange trading, and seek advice from an independent financial advisor if you have any doubts.
Recommended content
Editors’ Picks
EUR/USD holds above 1.0700 ahead of key US data
EUR/USD trades in a tight range above 1.0700 in the early European session on Friday. The US Dollar struggles to gather strength ahead of key PCE Price Index data, the Fed's preferred gauge of inflation, and helps the pair hold its ground.
USD/JPY jumps above 156.00 on BoJ's steady policy
USD/JPY has come under intense buying pressure, surging past 156.00 after the Bank of Japan kept the key rate unchanged but tweaked its policy statement. The BoJ maintained its fiscal year 2024 and 2025 core inflation forecasts, disappointing the Japanese Yen buyers.
Gold price flatlines as traders look to US PCE Price Index for some meaningful impetus
Gold price lacks any firm intraday direction and is influenced by a combination of diverging forces. The weaker US GDP print and a rise in US inflation benefit the metal amid subdued USD demand. Hawkish Fed expectations cap the upside as traders await the release of the US PCE Price Index.
Sei Price Prediction: SEI is in the zone of interest after a 10% leap
Sei price has been in recovery mode for almost ten days now, following a fall of almost 65% beginning in mid-March. While the SEI bulls continue to show strength, the uptrend could prove premature as massive bearish sentiment hovers above the altcoin’s price.
US core PCE inflation set to signal firm price pressures as markets delay Federal Reserve rate cut bets
The core PCE Price Index, which excludes volatile food and energy prices, is seen as the more influential measure of inflation in terms of Fed positioning. The index is forecast to rise 0.3% on a monthly basis in March, matching February’s increase.