Crude Oil tests multi-week high before receding on supply buildup, WTI back below $77.00
- Crude Oil eased on Wednesday after an early jump.
- US Crude stocks continue to build faster than markets anticipated.
- Geopolitical headlines put a floor below barrel prices.

West Texas Intermediate (WTI) US Crude Oil tested into fresh multi-week highs near $78.50 early Wednesday before US barrel counts showed a surprise build-up once again, knocking Crude Oil bids down once more. WTI slipped back below $77.00 per barrel after Energy Information Administration (EIA) barrel counts showed millions of barrels of excess Crude Oil supply piping through US markets that investors hadn’t anticipated, chewing away at an overarching energy market narrative about global supply constraints that continue to fail to materialize.
According to the EIA on Wednesday, US Crude Oil inventories surged by 12.018 million barrels through the week ended February 9, well above the forecast 2.6 million barrel uptick and adding to the previous week’s buildup of 5.521 million barrels.
This comes in addition to the American Petroleum Institute’s (API) reported buildup on Tuesday of 8.52 million barrels for the same period. The EIA reported buildup saw its biggest one-week barrel count increase in 12 months, while the API supply build was its largest since November.
Crude Oil downside remains limited as geopolitical headlines continue to weigh on investors, keeping barrel bids on the high side as investors begin to worry more about the decreasing likelihood of a ceasefire in the ongoing Gaza conflict between Israel and Palestinian Hamas.
WTI technical outlook
Despite testing into its highest bids in nearly three weeks, WTI saw a sharp pullback on Wednesday, setting US Crude Oil up for its first down day after seven consecutive closes in the green. WTI set an intraday high of $78.43 before falling back below the $77.00 handle to test $76.50.
Wednesday’s pullback sees US Crude Oil forming a bearish rejection from the 200-day Simple Moving Average (SMA) near $77.40, and WTI is at risk of continuing to churn within a consolidation zone between the 200-day SMA and the 50-day SMA near $73.55.
WTI hourly chart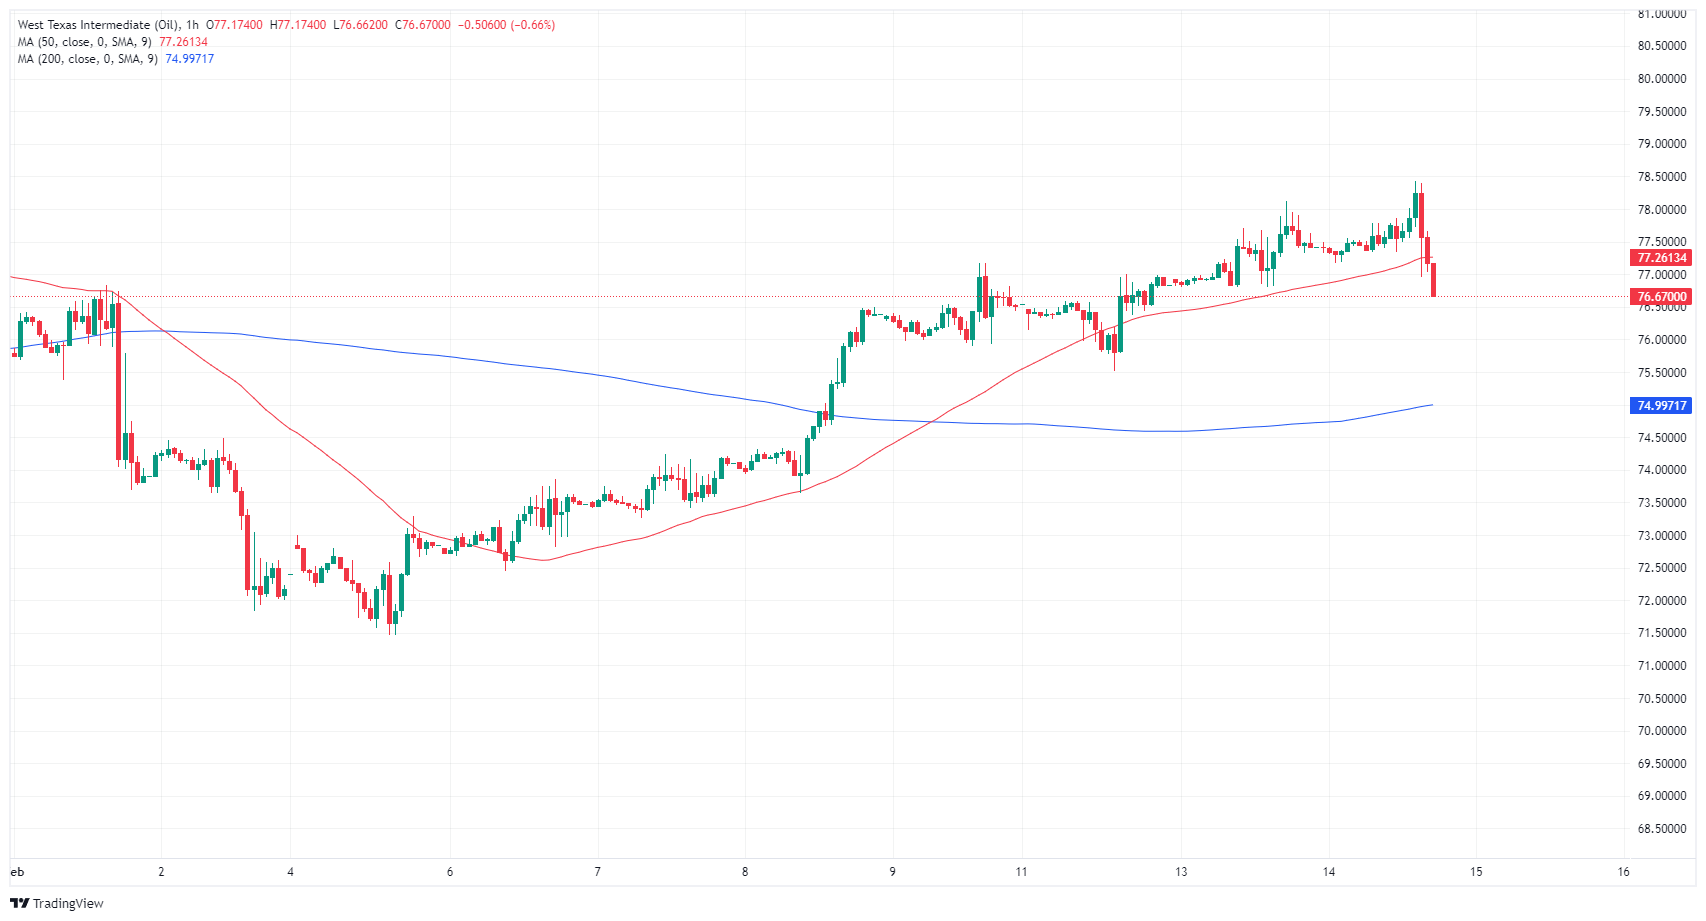
WTI daily chart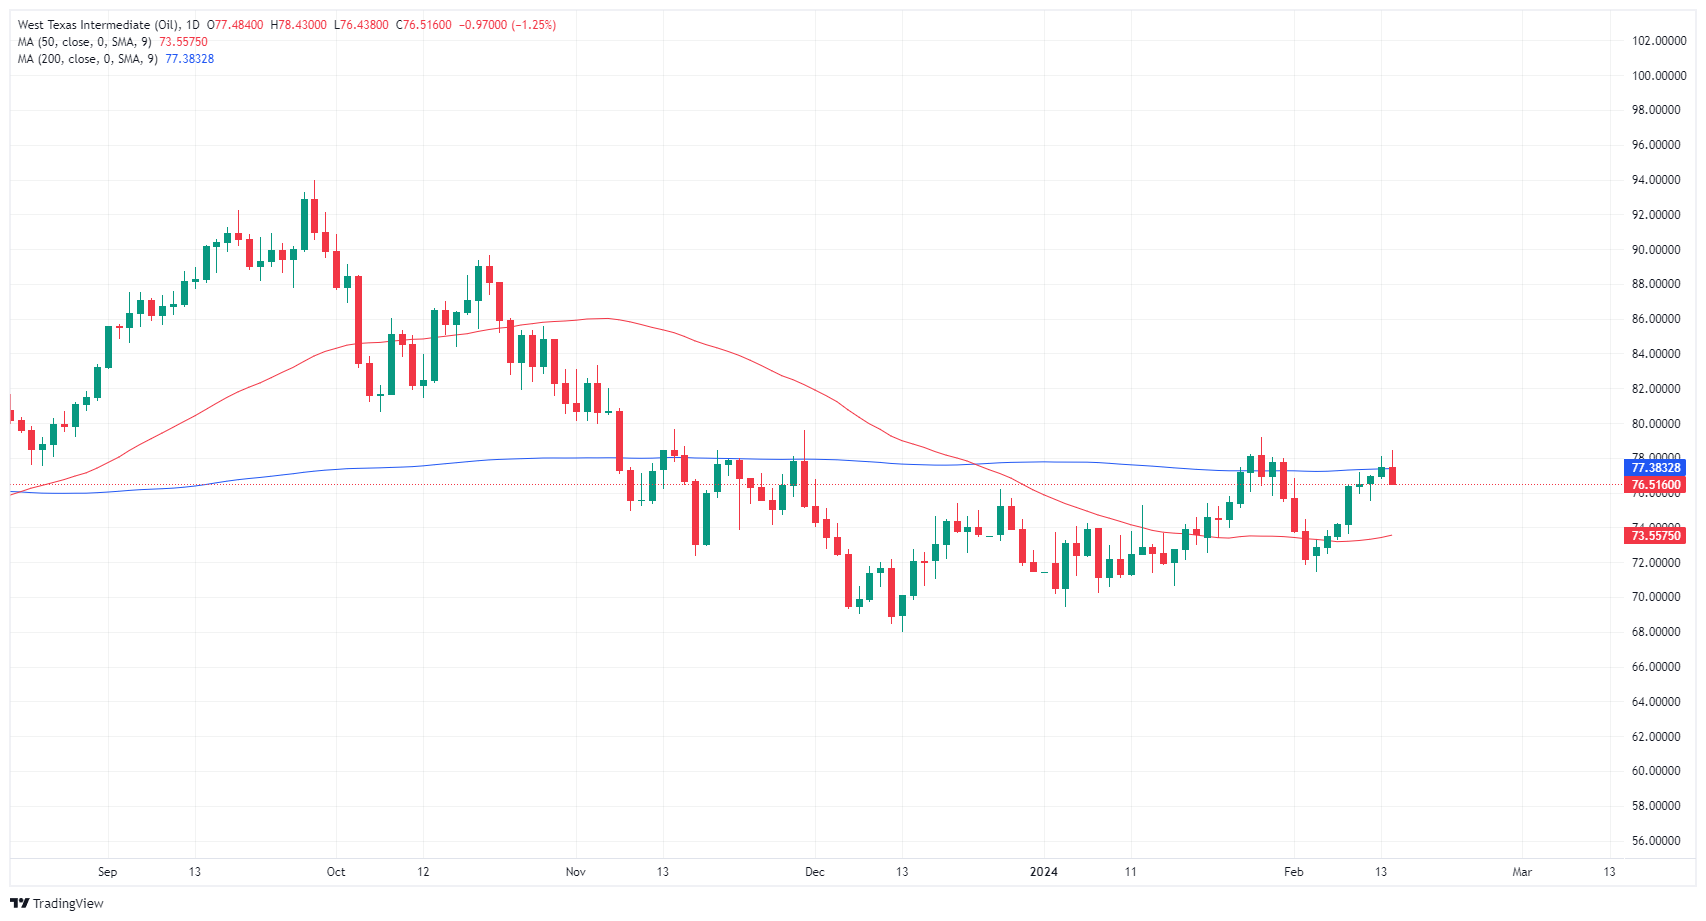
Author

Joshua Gibson
FXStreet
Joshua joins the FXStreet team as an Economics and Finance double major from Vancouver Island University with twelve years' experience as an independent trader focusing on technical analysis.


![How Wall Street rigs the game [Video]](https://editorial.fxsstatic.com/images/i/market-chaos-01.jpg)














