|

Crude Oil Technical Analysis: Black Gold on a bull run as $53.00 a barrel is the level to beat
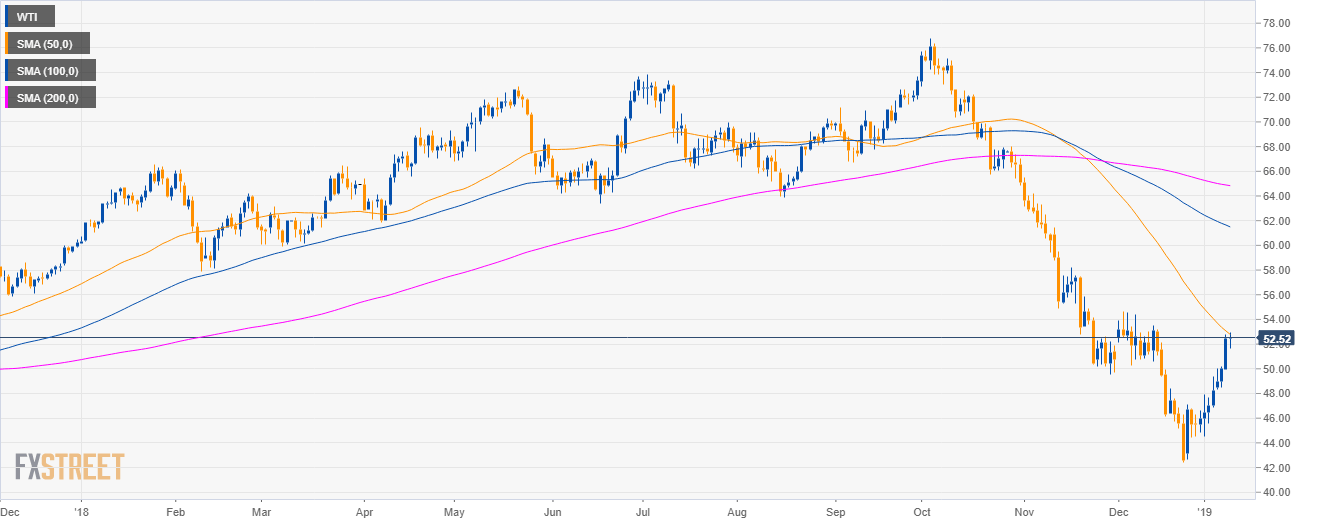
Oil daily chart

  • Crude oil WTI is trading in a bear trend below the 200-period simple moving average (SMA). 
  • Bulls are creating a reversal us as they are testing the 50 SMA. 
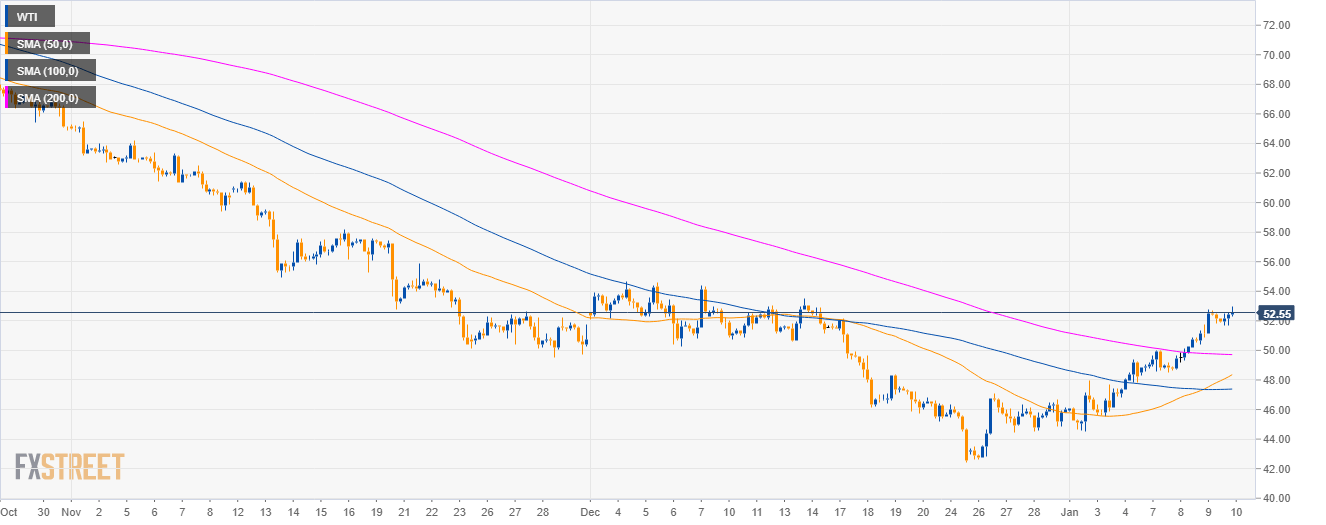
Oil 4-hour chart

  • Bulls have regained the main SMAs suggesting bullish momentum in the medium-term.
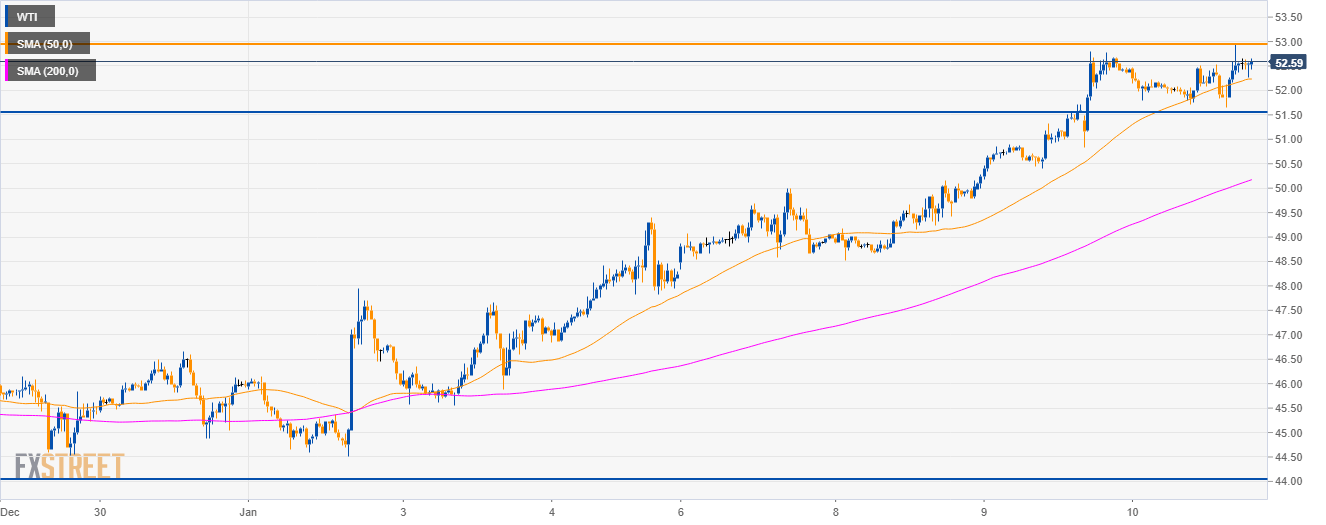
Oil 30-minute chart

  • Oil is trading above its main SMAs suggesting strong bullish momentum. 
  • The level to beat for bulls is $53.00 a barrel. A break of the level can lead to 55.65 target in the near future. 
  • Support is seen at 51.50. 

Additional key levels

WTI

Overview:
    Today Last Price: 52.5
    Today Daily change: 7.0 pips
    Today Daily change %: 0.134%
    Today Daily Open: 52.43
Trends:
    Previous Daily SMA20: 48.11
    Previous Daily SMA50: 52.05
    Previous Daily SMA100: 61.03
    Previous Daily SMA200: 64.88
Levels:
    Previous Daily High: 52.8
    Previous Daily Low: 49.97
    Previous Weekly High: 49.41
    Previous Weekly Low: 44.52
    Previous Monthly High: 54.68
    Previous Monthly Low: 42.45
    Previous Daily Fibonacci 38.2%: 51.72
    Previous Daily Fibonacci 61.8%: 51.05
    Previous Daily Pivot Point S1: 50.67
    Previous Daily Pivot Point S2: 48.9
    Previous Daily Pivot Point S3: 47.84
    Previous Daily Pivot Point R1: 53.5
    Previous Daily Pivot Point R2: 54.56
    Previous Daily Pivot Point R3: 56.33

Author

Flavio Tosti

Flavio Tosti

Independent Analyst


More from Flavio Tosti
Share:

Editor's Picks

EUR/USD looks to regain the 200-day SMA

EUR/USD regains some balance and trade just above 1.1600 the figure ahead of the opening bell in Asia. The pair initially dipped to the 1.1530 zone for the first time since November, always following the stronger US Dollar and the marked flight-to-safety in the context of the ongoing Middle East crisis
 

GBP/USD slips below key averages as geopolitical risks mount

GBP/USD fell about 0.35% on Tuesday, settling around 1.3350 after slipping below the 200-day Exponential Moving Average for the first time since early December. The pair has pulled back sharply from its late-January high near 1.3870, shedding over 500 pips in a series of lower highs and lower lows. 

Gold falls to near $5,100 as inflation fears weigh amidst Middle East conflict

Gold price faces some selling pressure near $5,100 during the early Asian session on Wednesday. The precious metal falls amid a renewed US Dollar demand and dimming prospects for US rate cuts. The US ISM Services Purchasing Managers Index report will be published later on Wednesday. 

Ethereum: Whales step up buying as short positions contract

After holding firm heading into the last weekend, Ethereum whales have returned to action, pouncing on the volatility stemming from escalating military actions between the US and Iran.

Energy shock 2.0: Why rising Gas prices could hit the Euro

Even without a confirmed, sustained disruption, the mere risk to a key global energy chokepoint is enough to inject a significant premium into European Gas markets. And for the Euro, that matters.

Ripple falters amid sell-off jitters and negative funding rates

Ripple (XRP) has come under pressure, drifting lower to $1.35 at the time of writing on Tuesday. The over 2% correction looks poised to erase the previous day’s gains, which lifted the remittance token to $1.42.