Could VIPS continue its bullish momentum after 140% rally since October? [Video]
![Could VIPS continue its bullish momentum after 140% rally since October? [Video]](https://editorial.fxstreet.com/images/TechnicalAnalysis/ChartPatterns/Chartism/financial-graph-19311174.jpg)
Vipshop Holdings Ltd ADR (VIPS) is an e-commerce platform that specializes in flash sales of branded products in China. Its website VIP.com is one of the biggest online retailers in China. VIPS is listed on NYSE as ADR.
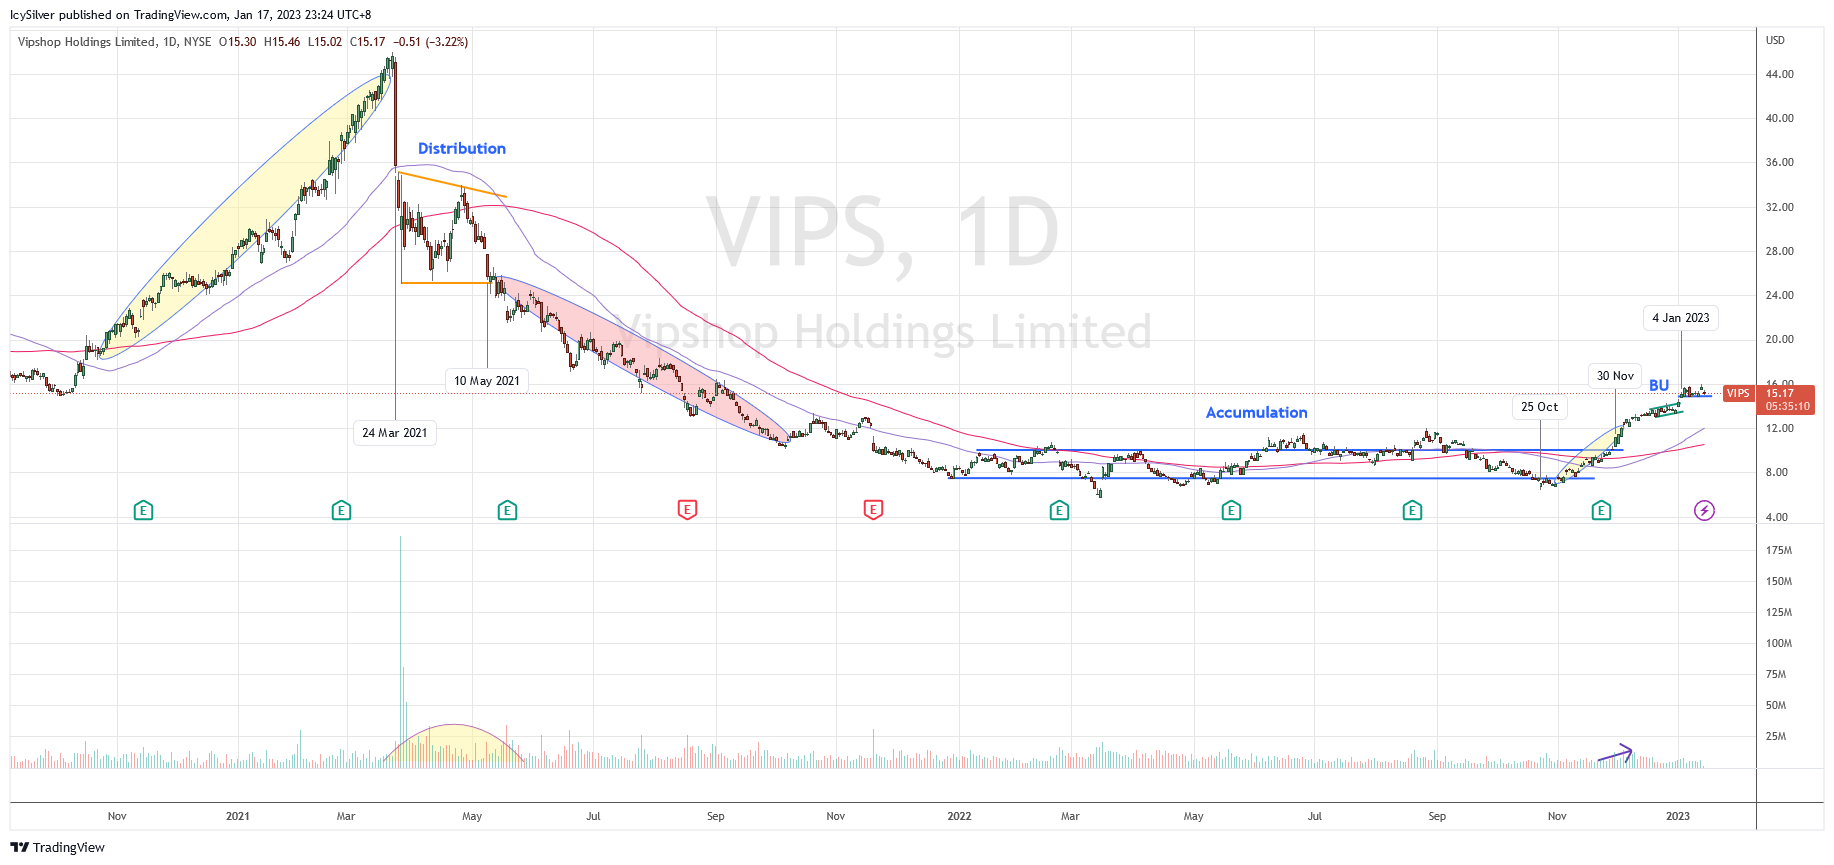
In this 28-month chart of VIPS, the price started an impressive climatic run up in Oct 2020 that lasted until March 2021. It hit an all time high at $46 but a significant Wyckoff change of character (CHoCH) on 24 Mar turned the stock from bullish to Wyckoff distribution. This phase was accompanied by very large volume suggesting the presence of supply.
The price was unable to stay above $25 around 10 May 2021 and slided down in Wyckoff sign of weakness (SOW). The down trend continued until Jan 2022 where it then moved in a Wyckoff accumulation range between $7.50 and $10. There were several attempts to test the low and upthrust during this period.
The change likely started in late Oct 2022 where a Wyckoff spring action occurred. The price followed through with a Wyckoff sign of strength (SOS) rally. It was the best rally thus far and on 30 Nov, it broke out of the range. The subsequent reaction was a further rally and a Wyckoff back up (BU). This was confirmation of a bullish sign. The price then broke out of BU on 4 Jan 2023.
Bias
Bullish. According to the Wyckoff method, VIPS is now in mark up phase E. It will likely challenge the resistance at $16 and eventually the $25 axis.
If the price breaks below $15, it may retest the support between $10 and $13.
Recently some of the China theme stocks are showing signs of outperforming the indices. This VIPS was discussed in detail in my weekly live group coaching. Find out how the Wyckoff method could help you find bullish stocks in my video below.
Author

Ming Jong Tey
Independent Analyst
Ming Jong Tey has been trading since 2008. He started his learning journey from technical analysis (indicators, Fibonacci, etc...) to value investing. Throughout his journey, he develops an interest in price action with chart pattern trading.


