Copper drops from two-month highs due to global economic slowdown, speculators’ shorts
- Copper prices are trading with losses of almost 1.50%.
- The Euro area energy crisis, China’s property and construction crisis, and a possible US recession are headwinds for copper.
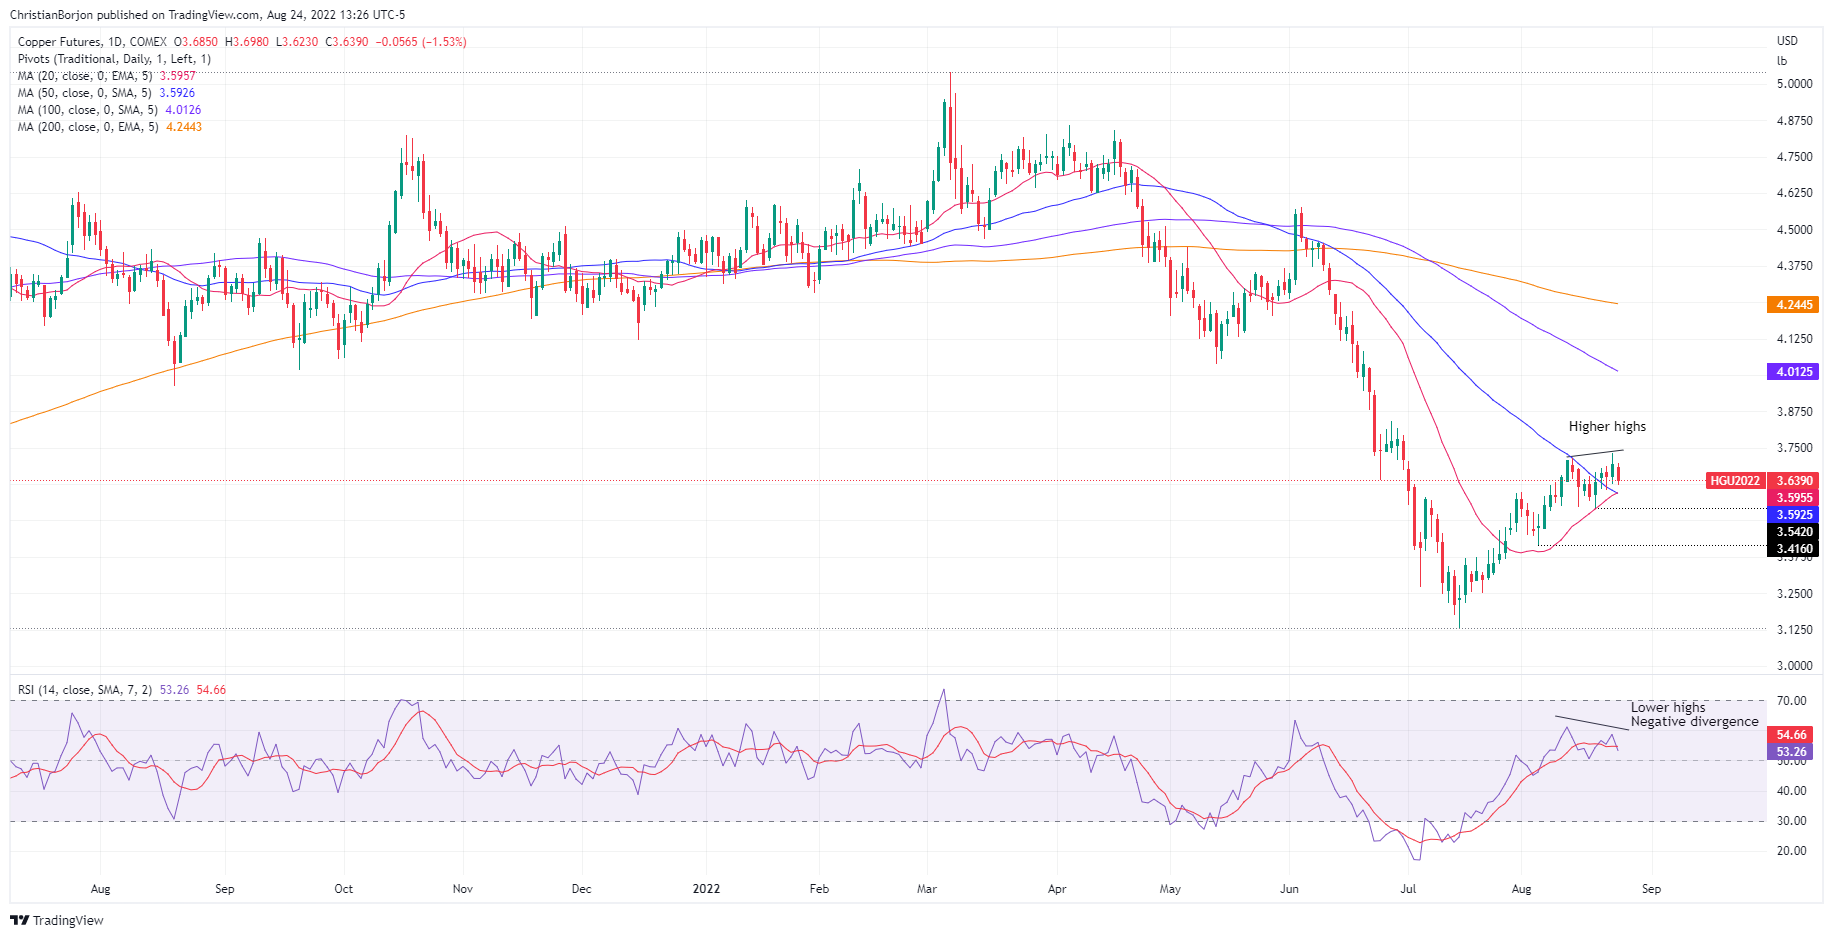
- Copper Price Analysis: Could test the monthly lows around $3.4160 once it clears $3.5420.

Copper futures are dropping for the first time in the week, down by 1.53% on Wednesday, courtesy of an ongoing global economic slowdown, portrayed in part by released S&P Global PMIs in the week, painting a gloomy picture while worries about China’s economy had increased. At the time of writing, Copper futures are trading at $3.6390 after hitting a daily high of $3.6980 during the Asian session.
US equities are trading in the green, portraying a positive mood. Meanwhile, the ongoing energy crisis in Europe, China’s property and construction market crisis, and recession fears in the US, are posing downward pressure on the red metal
In the meantime, the investment house Goehring & Rozencwajg Associates, in their Q2 update, pointed out that after bottoming at 165,000 tonnes at the end of 2021, copper inventories rebounded to 300,000 by mid-May but pulled back to 240,000 tonnes. They commented that inventories, when adjusted for days of consumption, are almost as low as in 2005, just before copper prices more than doubled. "In 2005, copper exchange inventories covered consumption by only two days.”
Aside from this, China’s appetite for the red metal, from which it accounts for 55% of the world’s copper consumption, its imports are up almost 6%. However, according to Shanghai Metals Market, stocks of copper in the country are at year lows.
All that said, Dr. Copper should be headed to the upside. Nevertheless, the Commitment of Traders report shows that speculators are net short 16,000 lots for the past six weeks, so a further downside is expected before recovering some ground.
Copper Price Analysis: Technical outlook
The Copper daily chart illustrates the non-yielding metal as neutral biased. The red metal remains seesawing for nine consecutive days in the $3.5420-$3.7315 area. However, it’s worth noting that the Relative Strength Index (RSI) recorded a successive series of lower highs, contrary to price action, meaning that prices are about to edge lower.
Hence, the first support would be the confluence of the 20 and 50-DMA around $3.5925-55. Once it’s broken, the next support will be the bottom of the range above-mentioned at $3.5420, followed by the August 3 low at $3.4160.
Author

Christian Borjon Valencia
FXStreet
Markets analyst, news editor, and trading instructor with over 14 years of experience across FX, commodities, US equity indices, and global macro markets.















