Comcast stock tests critical support: Two-level trade setup emerges

Comcast Corporation (CMCSA) is the media and telecommunications giant behind NBCUniversal and Xfinity services. The stock is approaching a technical inflection point that swing traders have been circling on their calendars. After a brutal descent from $45 earlier this year, the stock is now knocking on the door of a support zone that's held significance across multiple market cycles.
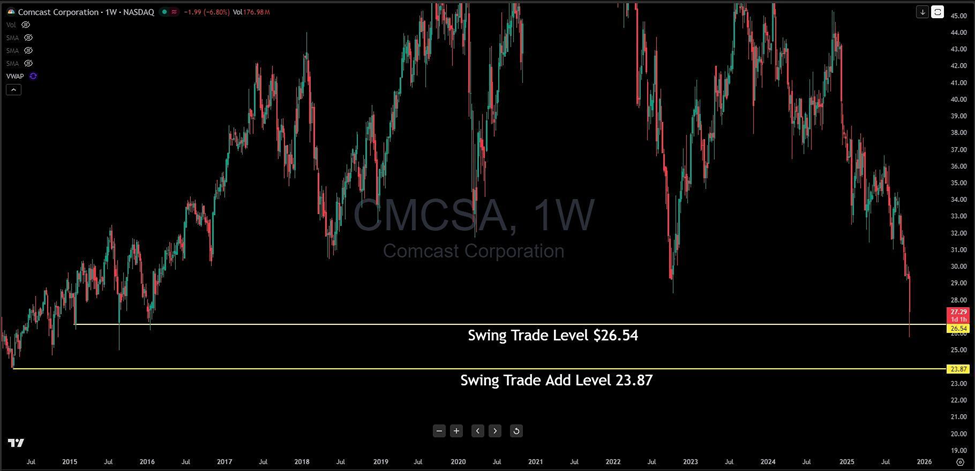
Let's unpack what makes this company worth analyzing. The weekly chart reveals a stark reality: CMCSA has surrendered nearly 40% of its value in a matter of months, carving out a downtrend that's been relentless in its trajectory. But then you notice something that changes the conversation entirely—that horizontal line at $26.54.
This isn't just another arbitrary price point. The $26.54 level has acted as both ceiling and floor during previous periods of market stress, most notably during the consolidation phases of 2022 and early 2023. Think of it as a battlefield where bulls and bears have repeatedly tested each other's resolve. When price approaches this zone, institutional memory kicks in, and order flow tends to shift.
What catches my attention is the measured approach to position sizing embedded in this setup. Rather than betting the farm at a single level, the structure here suggests a two-tiered entry strategy. The initial swing trade level at $26.54 represents your first line of defense—a zone where price has historically found buyers willing to step in. If that support crumbles and we see follow-through selling, the $23.87 level becomes your add zone, offering a more defensive entry with improved risk-reward dynamics.
But here's where discipline becomes non-negotiable. If CMCSA slices through $23.87 on substantial volume, the thesis breaks down. That would signal not just technical weakness, but potentially a fundamental re-rating of the company's prospects in an evolving media landscape. The bearish scenario would then target lower historical support zones, and you'd need to respect that price action rather than fight it.
The bullish case hinges on whether bargain hunters and dividend-focused investors view these levels as too attractive to ignore. A successful defense of $26.54 could trigger a relief rally back toward the $30-32 resistance zone, where overhead supply from trapped longs would likely materialize. That's roughly a 15% move from current levels—not earth-shattering, but respectable for a large-cap value play.
Volume will be your tell. Watch for climactic selling that exhausts itself at these support levels, followed by narrowing price ranges and stabilization. That's often how bottoms are built—not with dramatic V-shaped reversals, but through a grinding process where sellers simply run out of ammunition.
For those considering this setup, think in terms of tranches. Scale in at $26.54 with perhaps half your intended position, then reassess. If we get that second trip to $23.87, you've got dry powder to average down with conviction. In terms of a stop-loss level, a weekly close beneath $23.50 would be the line in the sand, signaling that deeper support zones need to be tested before any sustainable bounce materializes.
The risk-reward profile here favors the patient trader willing to endure some volatility. CMCSA isn't going to zero—it's a cash-generating machine with entrenched infrastructure assets. But Comcast is also not the growth darling it once was, which means any recovery will likely be measured rather than explosive. Set realistic expectations, respect the levels, and let the market show its hand before committing significant capital.
What unfolds at these technical junctures often teaches us more about market psychology than any indicator ever could. Will buyers emerge with conviction, or does this stock have further to fall before finding its footing? The next few weeks will answer that question definitively.
Author

Benjamin Pool
Verified Investing
A seasoned financial expert with a passion for empowering individuals to mastering smart money management.


