|

Chevron Inc (CVX) Elliott Wave technical analysis [Video]

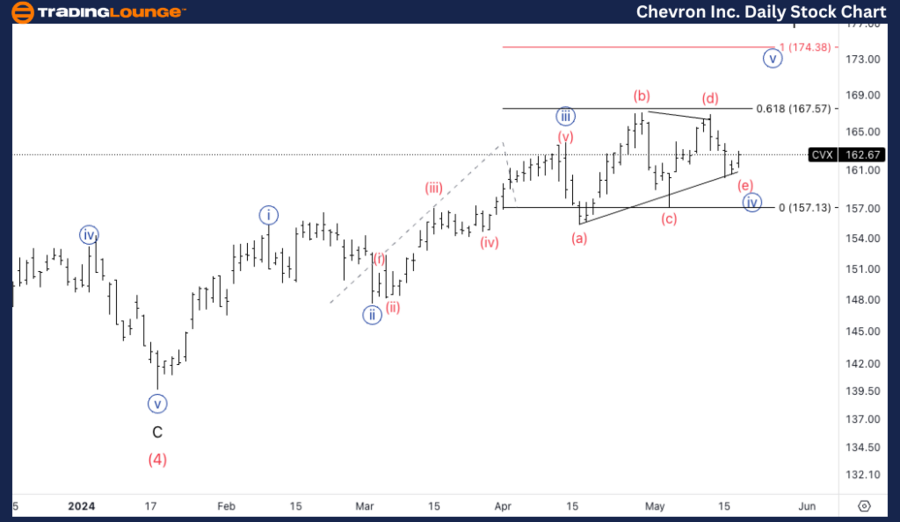
CVX Elliott Wave Analysis Trading Lounge Daily Chart,

Chevron Inc., (CVX) Daily Chart.

CVX Elliott Wave technical analysis

Function: Trend.

Mode: Impulsive.

Structure: Motive.

Position: Minor wave 1.  

Direction: Upside in Minute {v}.  

Details: Looking for a top in Minor wave 1, to ideally break previous wave B top at 171$ to give us additional upside confirmation.

Chart

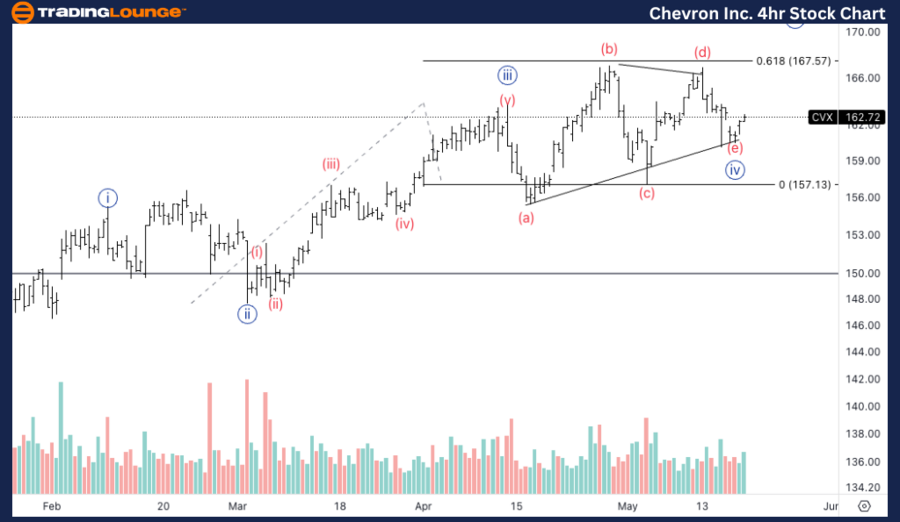
CVX Elliott Wave Analysis Trading Lounge 4Hr Chart,

Chevron Inc.,  (CVX) 4Hr Chart.

CVX Elliott Wave technical analysis

Function: Trend.

Mode: Impulsive.

Structure: Motive.

Position: Wave (e) of {iv}.

Direction: Upside in wave (i) of {v}.

Details: Looking for the potential triangle in wave {iv} to be completed and look for upside resumption.

Chart

Explore the latest Elliott Wave analysis for Chevron (CVX) as of May 20, 2024. Discover key support and resistance levels and potential price targets for CVX stock.

ETN Elliott Wave technical analysis – Daily chart

Chevron (CVX) is currently in the final stages of Minor wave 1, with an expected top in Minute wave {v}. We are looking for a break above the previous wave B top at $171, which would provide additional confirmation of further upside potential.

ETN Elliott Wave technical analysis – Four hour chart

On the 4-hour chart, CVX appears to be completing a potential triangle formation in wave {iv}. Once this triangle is completed, we expect an upside resumption in wave (i) of {v}.

Technical analyst: Alessio Barretta.

CVX Elliott Wave technical analysis

Author

Peter Mathers

Peter Mathers

TradingLounge

Peter Mathers started actively trading in 1982. He began his career at Hoei and Shoin, a Japanese futures trading company.

More from Peter Mathers
Share:

Editor's Picks

EUR/USD flirts with daily highs, retargets 1.1900

EUR/USD regains upside traction, returning to the 1.1880 zone and refocusing its attention to the key 1.1900 barrier. The pair’s slight gains comes against the backdrop of a humble decline in the US Dollar as investors continue to assess the latest US CPI readings and the potential Fed’s rate path.

GBP/USD remains well bid around 1.3650

GBP/USD maintains its upside momentum in place, hovering around daily highs near 1.3650 and setting aside part of the recent three-day drop. Cable’s improved sentiment comes on the back of the Greenback’s  irresolute price action, while recent hawkish comments from the BoE’s Pill also collaborate with the uptick.

Gold clings to gains just above $5,000/oz

Gold is reclaiming part of the ground lost on Wednesday’s marked decline, as bargain-hunters keep piling up and lifting prices past the key $5,000 per troy ounce. The precious metal’s move higher is also underpinned by the slight pullback in the US Dollar and declining US Treasury yields across the curve.

Crypto Today: Bitcoin, Ethereum, XRP in choppy price action, weighed down by falling institutional interest 

Bitcoin's upside remains largely constrained amid weak technicals and declining institutional interest. Ethereum trades sideways above $1,900 support with the upside capped below $2,000 amid ETF outflows.

Week ahead – Data blitz, Fed Minutes and RBNZ decision in the spotlight

US GDP and PCE inflation are main highlights, plus the Fed minutes. UK and Japan have busy calendars too with focus on CPI. Flash PMIs for February will also be doing the rounds. RBNZ meets, is unlikely to follow RBA’s hawkish path.

Ripple Price Forecast: XRP potential bottom could be in sight

Ripple edges up above the intraday low of $1.35 at the time of writing on Friday amid mixed price actions across the crypto market. The remittance token failed to hold support at $1.40 the previous day, reflecting risk-off sentiment amid a decline in retail and institutional sentiment.