|

Chevron (CVX) flat correction remains in progress

Chevron is a major global energy company involved in oil and gas exploration, production, refining, and marketing. Operating in over 180 countries, the company emphasizes sustainability, innovation, and corporate responsibility, with a focus on maintaining substantial energy reserves and addressing environmental concerns.

Chevron monthly Elliott Wave chart

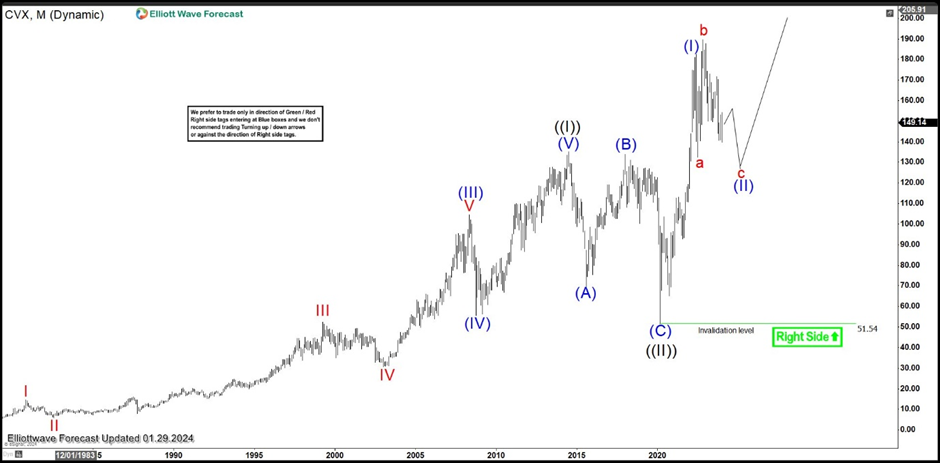
Monthly Elliott Wave chart of Chevron (CVX) above shows that the stock has traded sideways since making all time high on November 14, 2022 at 189.68. It’s currently pulling back in wave (II) to correct cycle from 3.19.2020 low as an expanded flat Elliott Wave structure. Rally from 3.19.2020 low ended wave (I) at 182.4. Down from there, wave a ended at 132.54 and wave b ended at 189.68. Wave c lower is in progress as a 5 waves. Down from wave b, wave ((1)) ended at 149.74 and wave ((2)) ended at 171.7. Wave ((3)) lower ended at 140.92. Expect wave ((4)) rally to fail and then stock to do another leg wave ((5)) to end wave c of (II) before the rally resumes. As far as pivot at 51.97 low stays intact, the stock should see further upside again once wave (II) correction is over.

Chevron daily Elliott Wave chart

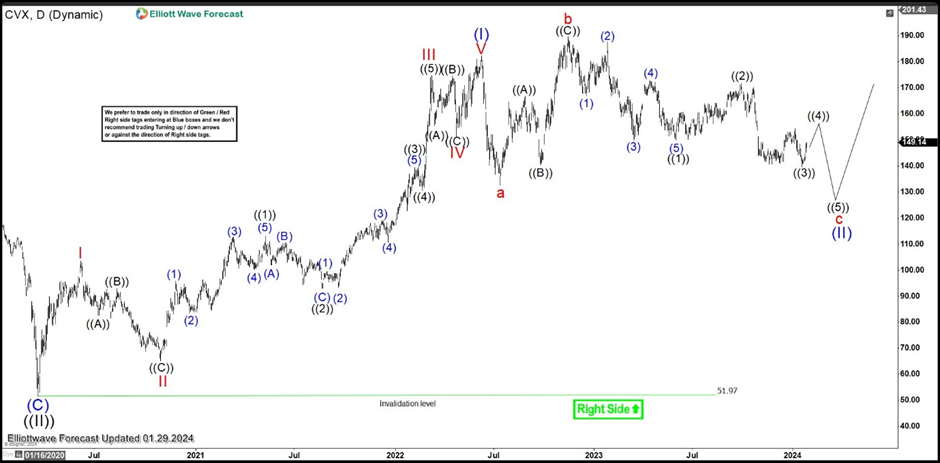
Daily Elliott Wave view in Chevron above shows wave c of (II) Expanded Flat is in progress as a 5 waves diagonal. Down from wave b, wave ((1)) ended at 149.74 and wave ((2)) ended at 171.7. Wave ((3)) lower ended at 139.62. Wave ((4)) rally is currently in progress but another leg lower can’t be ruled out to finish wave ((5)). This should complete wave c of (II), then the stock can resume higher again.

Author

Elliott Wave Forecast Team

Elliott Wave Forecast Team

ElliottWave-Forecast.com

More from Elliott Wave Forecast Team
Share:

Markets move fast. We move first.

Orange Juice Newsletter brings you expert driven insights - not headlines. Every day on your inbox.

By subscribing you agree to our Terms and conditions.

Editor's Picks

EUR/USD trims losses and returns to the 1.1750 area

The US Dollar resumed its decline in the American afternoon, helping EUR/USD trim early losses. The pair trades around 1.1750 as market participants gear up for the European Central Bank monetary policy decision and the United States Consumer Price Index.

GBP/USD flirts with 1.3400 after nearing 1.3300

The GBP/USD changed course after dipping with UK inflation data, and trades near the 1.3400 mark, as investors expect the Bank of England to deliver a 25 basis points interest rate cut after the two-day meeting on Thursday.

Gold maintains its positive momentum, trades around $4,330

The XAU/USD pair gained on a deteriorated market mood, trading near its weekly highs near $4,340. The bright metal advances with caution as market players await first-tier events in Europe and hte United States.

Bitcoin risks deeper correction as ETF outflows mount, derivative traders stay on the sidelines

Bitcoin (BTC) remains under pressure, trading below $87,000 on Wednesday, nearing a key support level. A decisive daily close below this zone could open the door to a deeper correction.

Monetary policy: Three central banks, three decisions, the same caution

While the Fed eased its monetary policy on 10 December for the third consecutive FOMC meeting, without making any guarantees about future action, the BoE, the ECB and the BoJ are holding their respective meetings this week. 

Crypto Today: Bitcoin, Ethereum, XRP slide further as risk-off sentiment deepens

Bitcoin faces extended pressure as institutional investors reduce their risk exposure. Ethereum’s upside capped at $3,000, weighed down by ETF outflows and bearish signals. XRP slides toward November’s support at $1.82 despite mild ETF inflows.