Caterpillar trade idea: How to play the short term trend accelerating lower

Introduction
Volatility Markets provides trend following trade ideas for momentum traders. The Volatility Markets Newswire measures the direction and acceleration of a security and then structures a trade idea to capitalize on the trend. While trends have been shown to exist in markets over the past 100 years, they are no guarantee of future asset prices. You should take these ideas lightly and at your own risk.
The Volatility Markets software suggests trade structures to capitalize on market trends. This article will discuss a 1 week risky CAT Short trade idea designed to take advantage of the last session trend accelerating lower.
Part 1: The trade idea
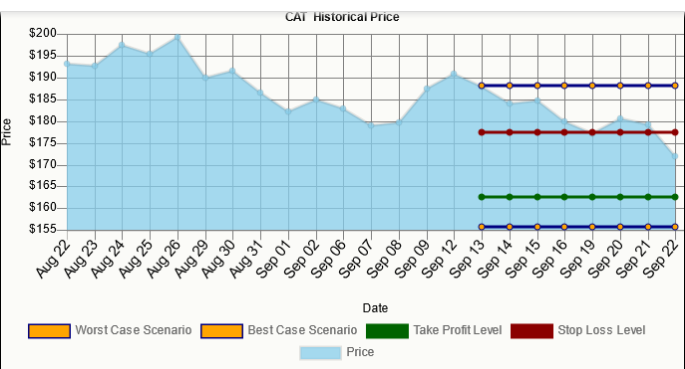
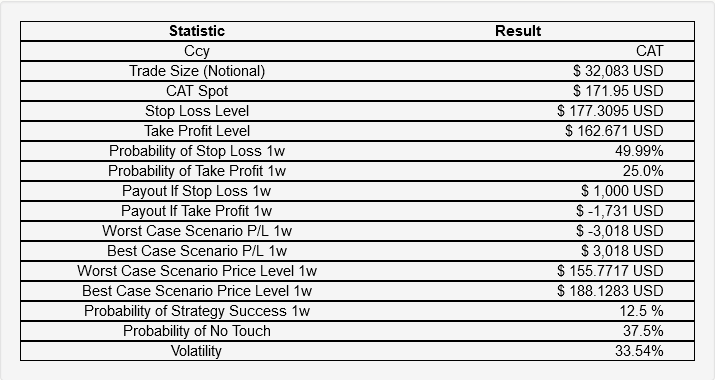
Short $ 32,083 USD , take profit at $ 162.671 level with 25.0% probability for a $ 1,731 USD gain, stop out at $ 177.3095 with 49.99% probability for a $ 1,000 USD loss over a 1w time horizon. We have determined that the short term trend is stronger than the long term trend.
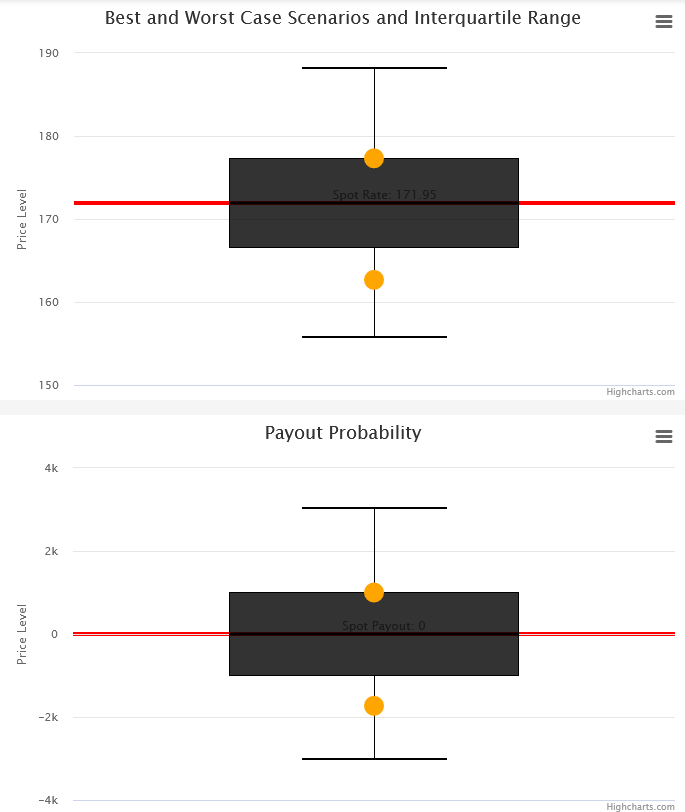
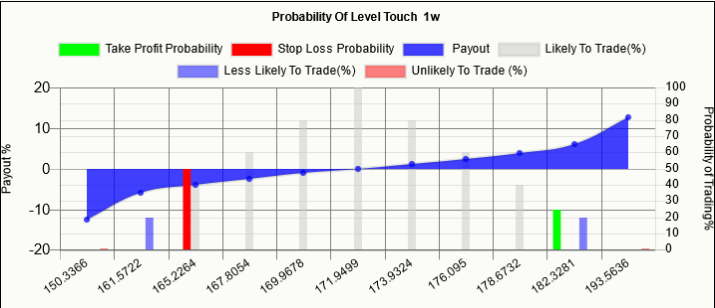
The BoxPlot below outlines the take profit and stop loss level placement of the trade idea, the inter-quartile range of expected traded outcomes, as well as the best and worst case scenario on the whiskers.
Part 2: Market summary
Key Takeaways:
-
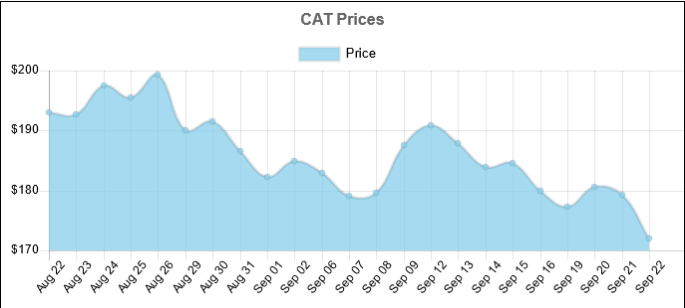
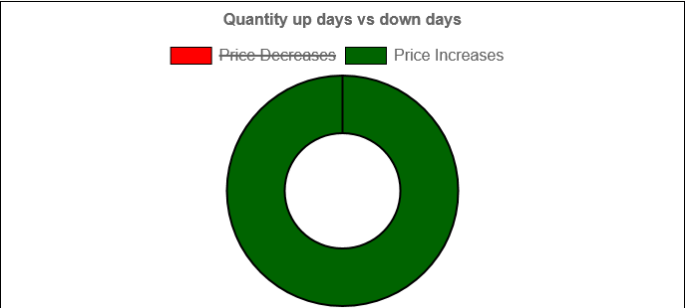
Over the past 22 days, the CAT price increased 9 days and decreased 13 Days.
-
For every up day, there were 1.44 down days.
-
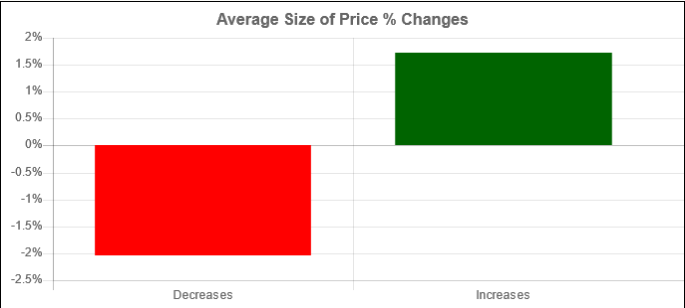
The average return on days where the price increased is 1.7167%.
-
The average return on days where the price decreased is -2.0376%.
-
Over the past 22 Days, the price has decreased by -10.96% percent.
-
Over the past 22 days, the average return per day has been -0.4982% percent.
-
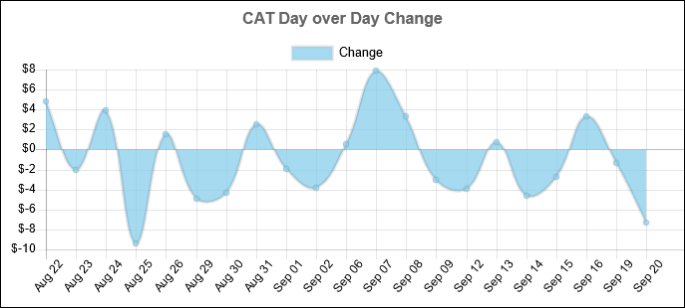
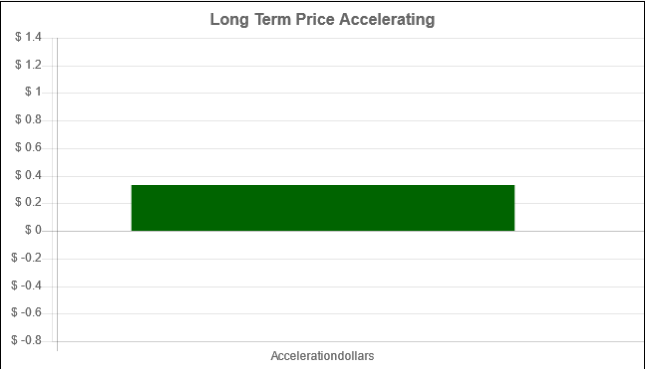
Over the past 22 days, The price has on average been accelerating: $ 0.3319 per day lower.
-
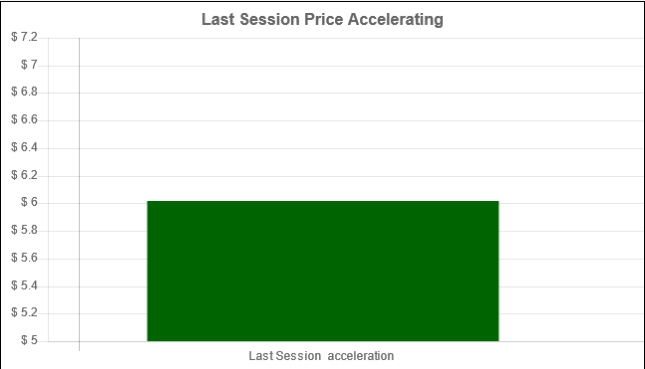
Over the last session, the price decreased by $ -7.33.
-
Over the last session, the price decreased by -4.2629 %.
-
Over the last session, the price accelerated by $ 6.02 Price today $ 171.95.
Price summary
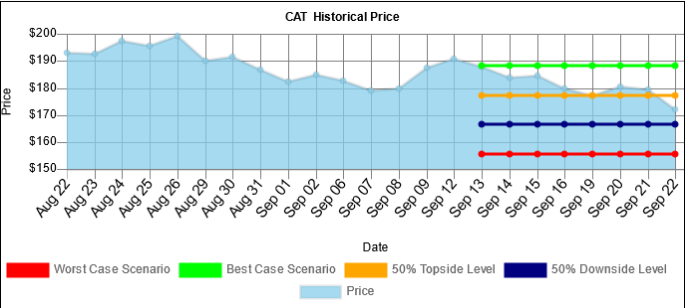
Today's last mid price was $ 171.95.
Price changes
Over the past 22 Days, the price has decreased by -10.96% percent.
Market skew
Over the past 22 days, the CAT price increased 9 days and decreased 13 Days.
For every up day, there were 1.44 down days.
The average return on days where the price increased is 1.7167%.
The average return on days where the price decreased is -2.0376%.
Expected range
Within 1 week, our worst case scenario where we are 95% certain that this level won't trade for CAT, is $ 155.7717 , and the best case scenario overnight is $ 188.1283 . levels outside of this range are unlikely, but still possible, to trade.
We are 50% confident that $ 177.3095 could trade and that $ 162.671 could trade. These levels are within statistical probability.
Part 3: Trade idea specifications
Long term trend analysis:
This trade goes short when the price was moving lower and accelerating over the past 22 days.
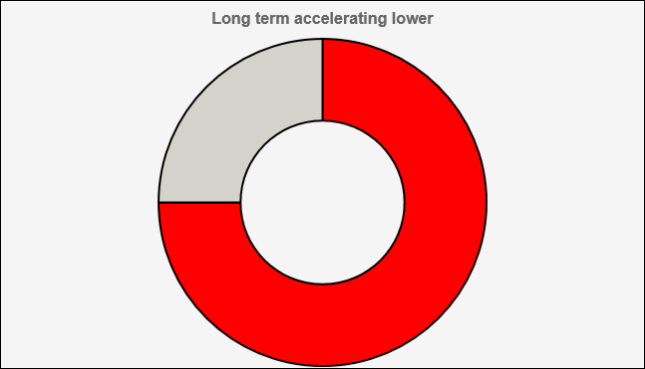
Over the past 22 days, the price has on average been accelerating $ 0.3319 per day
Short term trend analysis:
This trade goes short when the last change was lower and accelerating.
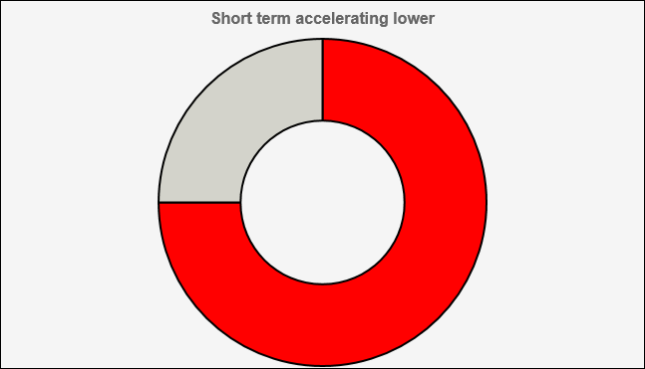
Over the last session, the price has accelerated $ 6.02.
Part 4: Scenario analysis
Probability vs payout chart:
This graph contrasts the percentage payout of holding a position vs the probability that the payout occurs. The red and green columns represent the probability of stopping out and taking profit and their associated payouts.
Scenario analysis:
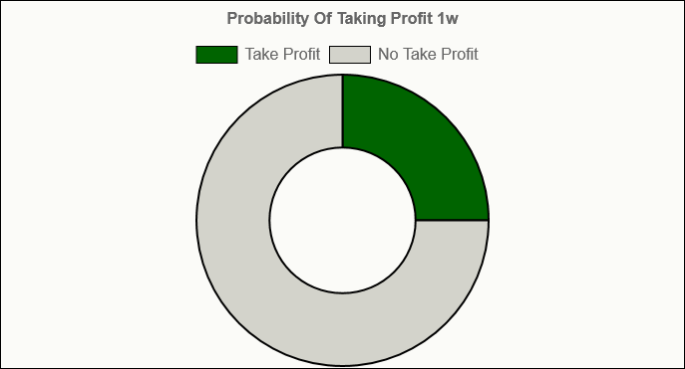
There is a 25.0% probability that the take profit level will independently trade over the 1w timeframe.
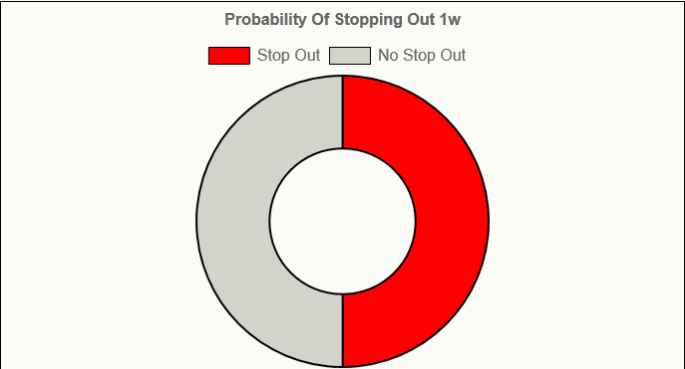
There is a 49.99% probability that the stop loss level will independently trade over the 1w timeframe.
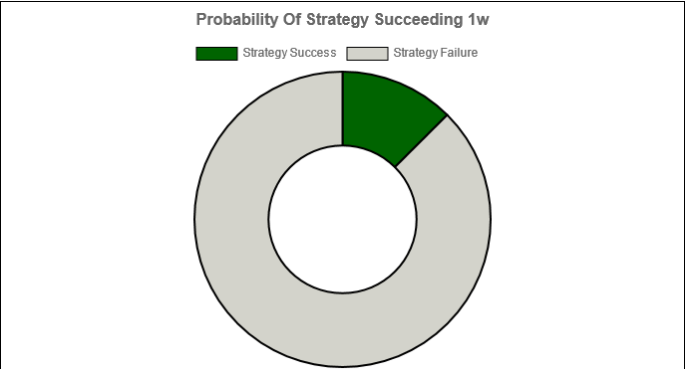
There is a 37.5% probability that neither the stop loss level nor take profit level will independently trade over the 1w timeframe.

There is a 12.5% probability that the strategy succeeds by having the take profit level touch and the stop loss level not touch over the 1w timeframe.
Author

Barry Weinstein
Volatility Markets Newswire
Barry Weinstein was a forex derivatives trader at BlueCrest Capital which was one of the largest hedge funds in Europe and then joined Credit Suisse where he assisted in running one of the largest FX Options portfolios in Europe.


