Canadian Dollar slumps for a third straight day as US Dollar climbs
- The Canadian Dollar shed weight for a third session against the Greenback.
- Loonie flows have reversed direction amid a general USD reversal.
- Double-header rate calls from the BoC and the Fed loom ahead this week.

The Canadian Dollar (CAD) pared further gains on Monday, marking the start of the new trading week with a renewed decline against the US Dollar (USD). The Loonie is down nearly 1.25% against the Greenback from last week’s peak, bolstering the USD/CAD pair back above 1.3700 and taking a fresh run at key technical averages.
The Bank of Canada (BoC) is slated to deliver its latest interest rate decision in the middle of the week. However, the United States (US) Federal Reserve (Fed) is also due with its own rate call, looming large over the BoC and the dueling interest rate statements are poised to throw the Canadian Dollar for a volatile loop.
Daily digest market movers: Interest rates, trade deals, and Russia sanctions weigh on FX markets
- The Canadian Dollar shed further weight, falling against a fast-rising US Dollar and sending the USD/CAD paid back into recent highs above 1.3700.
- US President Donald Trump is struggling to secure a desirable trade deal with the Canadian government. Canadian Prime Minister Mark Carney remains adamant that he has no interest in letting Donald Trump undercut his own USMCA deal that already balances trade between Canada and the US.
- The BoC is set for another rate call this week, alongside the US Fed. Both central banks are expected to keep interest rates on hold, however policymaker statements have taken on newfound importance.
- President Trump is also weighing cutting down the time before new Russian sanctions on specific products take effect as the Trump administration struggles to get Russia to do what it wants in Ukraine.
- Crude Oil markets saw an uptick in volatility after Trump publicly mused about cutting Russia’s deadline to solve the Ukraine war down to less than two weeks from Monday. Donald Trump is holding potential energy market sanctions on Russia if Russian President Vladmir Putin doesn’t do more to support Trump’s long-claimed status as a critical global dealmaker.
Canadian Dollar price forecast
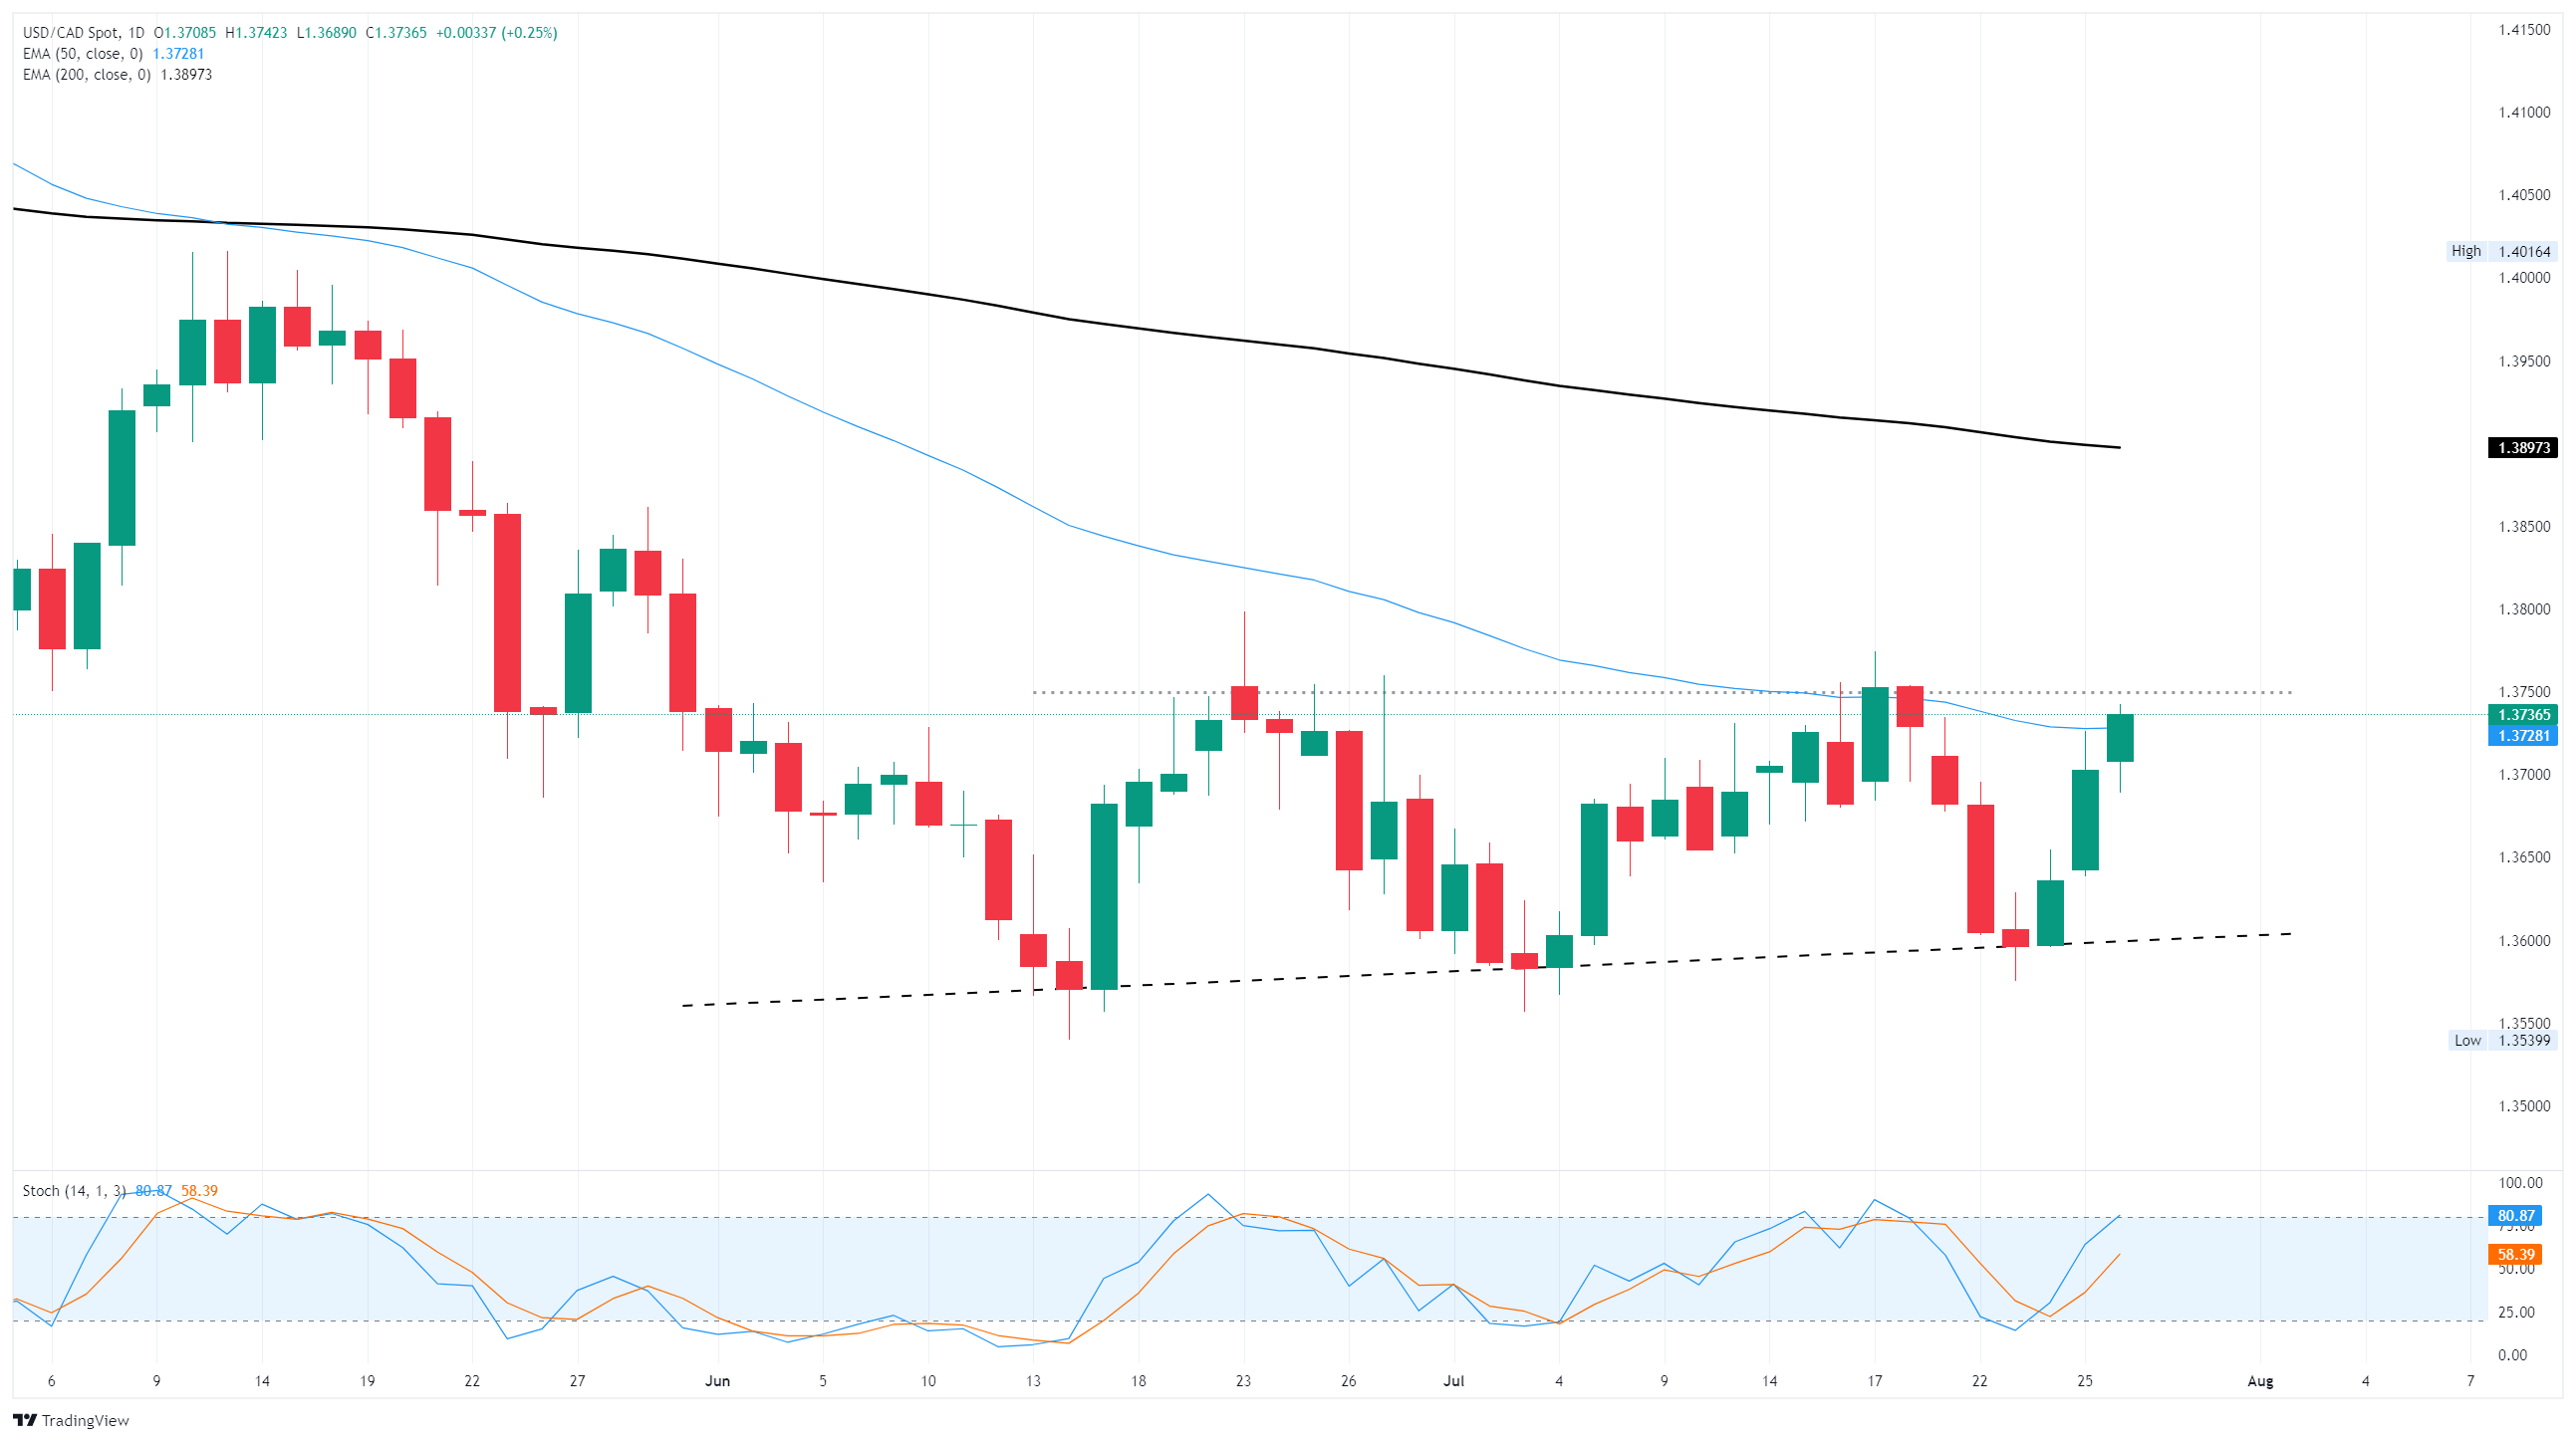
Monday’s one-sided price action behind the Canadian Dollar and the US Dollar sent USD/CAD back above the 1.3700 handle. The pair is now taking a fresh run at the 50-day Exponential Moving Average (EMA) near 1.3740.
Even if bulls are able to muscle USD/CAD into fresh multi-month highs above 1.3800, the 200-day EMA lies in wait near 1.3900, potentially capping long-term gains if the Greenback reverses its recent trend and begins to climb again.
USD/CAD daily chart
Dow Jones FAQs
The Dow Jones Industrial Average, one of the oldest stock market indices in the world, is compiled of the 30 most traded stocks in the US. The index is price-weighted rather than weighted by capitalization. It is calculated by summing the prices of the constituent stocks and dividing them by a factor, currently 0.152. The index was founded by Charles Dow, who also founded the Wall Street Journal. In later years it has been criticized for not being broadly representative enough because it only tracks 30 conglomerates, unlike broader indices such as the S&P 500.
Many different factors drive the Dow Jones Industrial Average (DJIA). The aggregate performance of the component companies revealed in quarterly company earnings reports is the main one. US and global macroeconomic data also contributes as it impacts on investor sentiment. The level of interest rates, set by the Federal Reserve (Fed), also influences the DJIA as it affects the cost of credit, on which many corporations are heavily reliant. Therefore, inflation can be a major driver as well as other metrics which impact the Fed decisions.
Dow Theory is a method for identifying the primary trend of the stock market developed by Charles Dow. A key step is to compare the direction of the Dow Jones Industrial Average (DJIA) and the Dow Jones Transportation Average (DJTA) and only follow trends where both are moving in the same direction. Volume is a confirmatory criteria. The theory uses elements of peak and trough analysis. Dow’s theory posits three trend phases: accumulation, when smart money starts buying or selling; public participation, when the wider public joins in; and distribution, when the smart money exits.
There are a number of ways to trade the DJIA. One is to use ETFs which allow investors to trade the DJIA as a single security, rather than having to buy shares in all 30 constituent companies. A leading example is the SPDR Dow Jones Industrial Average ETF (DIA). DJIA futures contracts enable traders to speculate on the future value of the index and Options provide the right, but not the obligation, to buy or sell the index at a predetermined price in the future. Mutual funds enable investors to buy a share of a diversified portfolio of DJIA stocks thus providing exposure to the overall index.
Author

Joshua Gibson
FXStreet
Joshua joins the FXStreet team as an Economics and Finance double major from Vancouver Island University with twelve years' experience as an independent trader focusing on technical analysis.

















