|

Caesars Entertainment (CZR) shows resilience amid market volatility

Caesars Entertainment, Inc. (CZR) operates more than 50 hotel and casino properties in the United States, making it a major player in the industry. The company is publicly traded on the NASDAQ exchange under the ticker symbol CZR. As with any hospitality company, its stock price can be subject to volatility, presenting opportunities for investors to profit from price fluctuations.

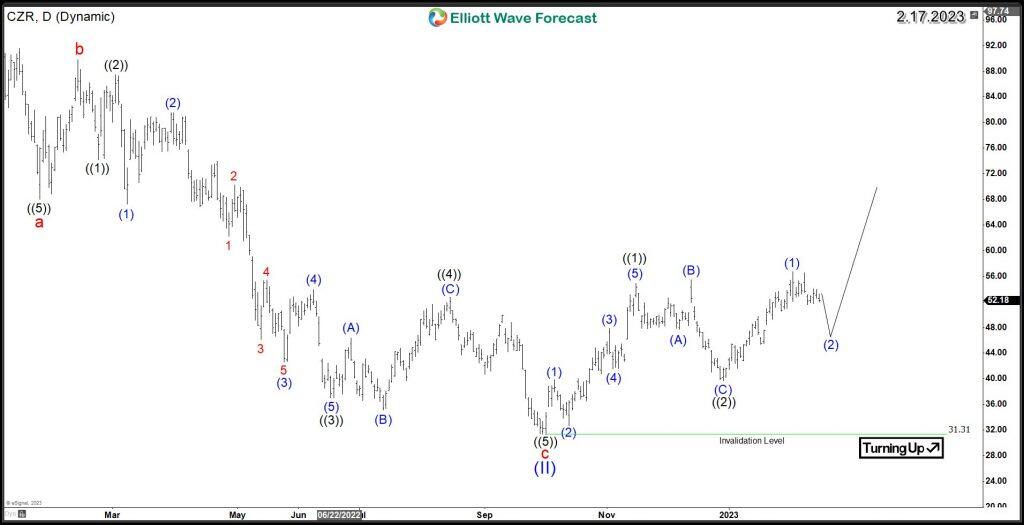
Our article will analyze the recent movements of Caesars Entertainment, Inc.’s (CZR) stock price by utilizing Elliott Wave Theory on the daily chart. Through this approach, we aim to provide a comprehensive overview of the current price action to help investors make informed decisions. Despite being trapped in a sideways range since last summer, CZR investors should recognize that bottoming out can be a time-consuming process, especially after the stock has experienced a more than 70% decline in the past year. However, since hitting a low of 31.31 in October 2022, the stock has managed to surge by 80%, with the price action unfolding as follows:

CZR initially rallied within an impulsive 5-wave structure in wave ((1)), followed by a 3-wave pullback in wave ((2)). The stock then went on to achieve a new high last month, breaking above the peak from December, which has opened up a bullish sequence from its October low. Based on the bullish structure, CZR’s short-term pullback is more likely to find support at the 50%-61.8% Fibonacci retracement levels (48.21-46.2). If the stock stays above its December low of 39.7 and buyers show up as expected, the next daily rally will ideally take the stock toward an initial target of 63.16 and a potential extension toward 77.72.

Caesars entertainment (CZR) Elliott Wave daily chart

CZR

To conclude, Caesars Entertainment’s stock (CZR) has displayed a promising trend recently, indicating potential for future growth in the near term. Although the stock has experienced significant declines in the past year, the current Elliott wave structure suggests that it may find support and potentially increase in value, leading to a positive upward trend. However, investors must conduct their due diligence, evaluate risks and rewards, and carefully consider all relevant factors before making any investment decisions.

Author

Elliott Wave Forecast Team

Elliott Wave Forecast Team

ElliottWave-Forecast.com

More from Elliott Wave Forecast Team
Share:

Markets move fast. We move first.

Orange Juice Newsletter brings you expert driven insights - not headlines. Every day on your inbox.

By subscribing you agree to our Terms and conditions.

Editor's Picks

EUR/USD bears await break below 100-day SMA support near 1.1665 area

The EUR/USD pair attracts heavy selling for the second straight day and dives to a nearly four-week trough, around the 1.1670 region, during the Asian session on Monday. Bearish traders now await a sustained break below the 100-day Simple Moving Average before positioning for an extension of the recent pullback from a three-month top, or levels just above the 1.1800 mark touched on December 24.

GBP/USD falls toward 1.3400 near 50-day EMA

GBP/USD extends its losses for the second successive session, trading around 1.3420 during the Asian hours on Monday. The technical analysis of the daily chart indicates that the 14-day Relative Strength Index at 53 has eased from near overbought, indicating that momentum has cooled while remaining above the midline. RSI holds above 50, keeping a modest bullish bias.

Gold on fire at the start of the week on US-Venezuela tensions

Gold regains upside traction early Monday as flight to safety prevails on Venezuela turmoil. The US Dollar finds strong haven demand, caps Gold’s upside as focus shifts to US jobs data. Gold’s daily technical setup suggests that more upside remains in the offing.

Bulls firmly in control as Bitcoin breaks $93K, Ethereum and Ripple extend gains

Bitcoin, Ethereum, and Ripple extended their rallies on Monday, gaining more than 4%, 6%, and 12%, respectively, in the previous week. The top three cryptocurrencies by market capitalization could continue to outperform, with bulls in control of the momentum.

Economic outlook 2026-2027 in advanced countries: Solidity test

After a year marked by global economic resilience and ending on a note of optimism, 2026 looks promising and could be a year of solid economic performance. In our baseline scenario, we expect most of the supportive factors at work in 2025 to continue to play a role in 2026.

Meme Coins Price Prediction: Dogecoin, Shiba Inu, Pepe rally on Venezuela’s shadow BTC reserve

Meme coins such as Dogecoin, Shiba Inu, and Pepe are leading the cryptocurrency market rally driven by the US cross-border operation to capture Venezuelan President Nicolás Maduro. Dogecoin extends its gain for the fifth consecutive day while SHIB and PEPE take a pause.