|

CAD/JPY Price Analysis: Struggles at 100.60s and retraces towards the 100.00 figure

  • The CAD/JPY remained downward pressured by falling oil prices and a risk-off impulse.
  • From a daily chart perspective, the CAD/JPY is consolidating at around the 100.00-101.00 range.
  • The CAD/JPY could shift downwards if buyers fail to hold prices above the 200-DMA.

The CAD/JPY faced solid resistance around 100.60 and retraced after posting a staggering 7.60% rally from March 24, when the pair printed its YTD low at 94.06. At the time of writing, the CAD/JPY is trading at 100.07, threatening to break below the 100.00 thresholds for the first time since April 14.

CAD/JPY Price Action

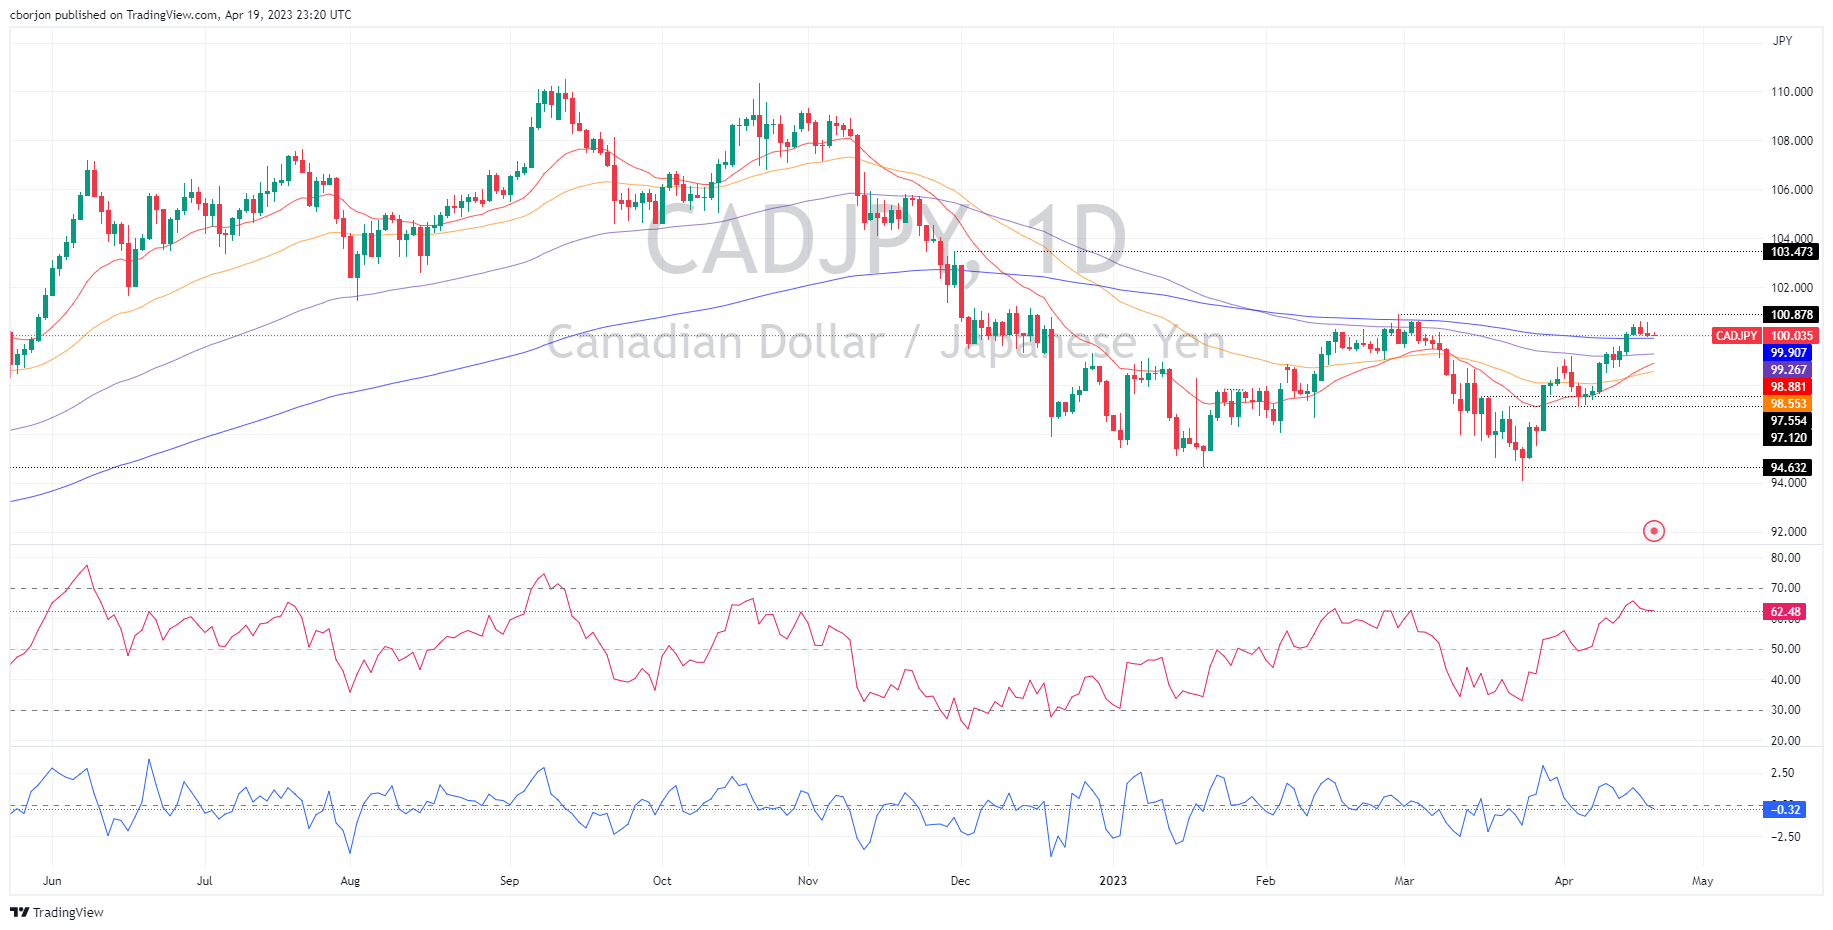
From a daily chart perspective, the CAD/JPY is neutral to upward biased, even though the pair broke above the 200-day EMA, lying at 99.90. Some fundamental news, like crude oil prices edging lower, weighed on the Canadian Dollar (CAD). In addition to the Relative Strength Index (RSI), turning flat and back-to-back bearish candlesticks could pave the way for a pullback.

If CAD/JPY breaks below the 200-day EMA, the 100-day EMA would be next at 99.26. If the pullback extends past the latter, a cluster of support lies at the 98.55/88 price level, the confluence of the 50 and 20-day EMAs, respectively., followed by April’s 5 cycle low at 97.09.

On the flip side, If CAD/JPY stays above 100.00, a test of the YTD high at 100.87 is on the cards. Once cleared, buyers could pose a threat to crack the 101.00 psychological level, followed by the next resistance, the November 30 high at 103.47.

CAD/JPY Daily Chart

CAD/JPY Daily Chart

CAD/JPY

Overview
Today last price100.07
Today Daily Change-0.10
Today Daily Change %-0.10
Today daily open100.17
 
Trends
Daily SMA2097.99
Daily SMA5098.5
Daily SMA10098.35
Daily SMA200102.32
 
Levels
Previous Daily High100.6
Previous Daily Low100.03
Previous Weekly High100.41
Previous Weekly Low97.62
Previous Monthly High100.64
Previous Monthly Low94.07
Daily Fibonacci 38.2%100.25
Daily Fibonacci 61.8%100.38
Daily Pivot Point S199.93
Daily Pivot Point S299.7
Daily Pivot Point S399.36
Daily Pivot Point R1100.5
Daily Pivot Point R2100.84
Daily Pivot Point R3101.07

Author

Christian Borjon Valencia

Markets analyst, news editor, and trading instructor with over 14 years of experience across FX, commodities, US equity indices, and global macro markets.

More from Christian Borjon Valencia
Share:

Editor's Picks

GBP/USD remains in two-day highs around 1.3260

GBP/USD adds to Friday’s bounce, gathering fresh traction and flirting with the 1.3270 zone on Monday, or two-day tops. Cable’s decent advance comes despite the move higher in the Greenback and investors’ assessing of UK PM K. Starmer's resignation.

EUR/USD remains offered; focus is on 1.1400

EUR/USD rapidly gives back Friday’s rebound and trades with marked losses near 1.1420, or three-month lows, in the latter part of Monday’s NA session. The pair’s intensifies its retracement following the continuation of the robust upside momentum in the US Dollar. Next on tap will be preliminary PMIs the Germany and the Euroland.

Gold bounces off lows, looks to surpass $4,200

Gold regains composure and leaves behind three-consecutive daily declines on Monday, looking to regain the area above the $4,200 mark per troy ounce. Reports of progress in the latest round of US-Iran talks are helping the precious metal maintain its footing at the start of the week, although the stronger Greenback seems to limit the upside potential for now.

XRP recovery underpinned by persistent ETF inflows
Ripple (XRP) gains momentum on Monday, trading above $1.15 as the crypto market widely recovers. This recovery comes amid easing geopolitical tensions in the Middle East, following reports that the United States (US) and Iran made progress in the first round of talks aimed at achieving a lasting peace agreement.
Is Shiba Inu dead or just in a crisis? The data behind SHIB's 95% crash

SHIB, the dog-themed meme coin that became one of the biggest success stories in crypto and turned early buyers into crypto millionaires, is facing tough times. Its price has fallen more than 32% so far this year, and it is down 95% from its all-time high in 2021. Is SHIB simply another fading meme coin, or is the market overlooking a possible recovery story?

Regime change: Inside Kevin Warsh's first move to make the Fed unreadable on purpose

The rate did not move. That was the least interesting thing about Kevin Warsh's first meeting in charge of the Fed. The FOMC held its benchmark at 3.50%-3.75% for the fourth straight meeting, exactly as priced, and then the new chair used his first press conference to dismantle the machinery the market has leaned on for a decade.