• The CAD/JPY tested the YTD highs above the 100.00 mark.
  • The cross-currency repair is in a choppy trading session, as the Asian Pacific session begins, up some 0.04%.
  • CAD/JPY Price Forecast: Remains tilted to the upside, though RSI is within overbought conditions, are subject to a mean reversion move.

The CAD/JPY is barely down as the Asian session begins, but short of weekly highs reached on Thursday above the 100.00 mark, lastly tested on March 28. At the time of writing, the CAD/JPY is trading at 99.92.

On Thursday, the CAD/JPY seesawed in the 99.60-100.10 range throughout the day, while the Relative Strength Index (RSI) at 74.67 remained within the overbought area. It usually would mean that the CAD/JPY might be subject to a mean reversion move, but as its slope is almost horizontal, the pair is consolidating around current price levels.

CAD/JPY Price Forecast: Technical outlook

The CAD/JPY daily chart shows that risk remains skewed to the upside, the same as the other JPY crosses. The pair keeps trading within the 98.00-100 range for the last ten days, unable to break above/below its boundaries.

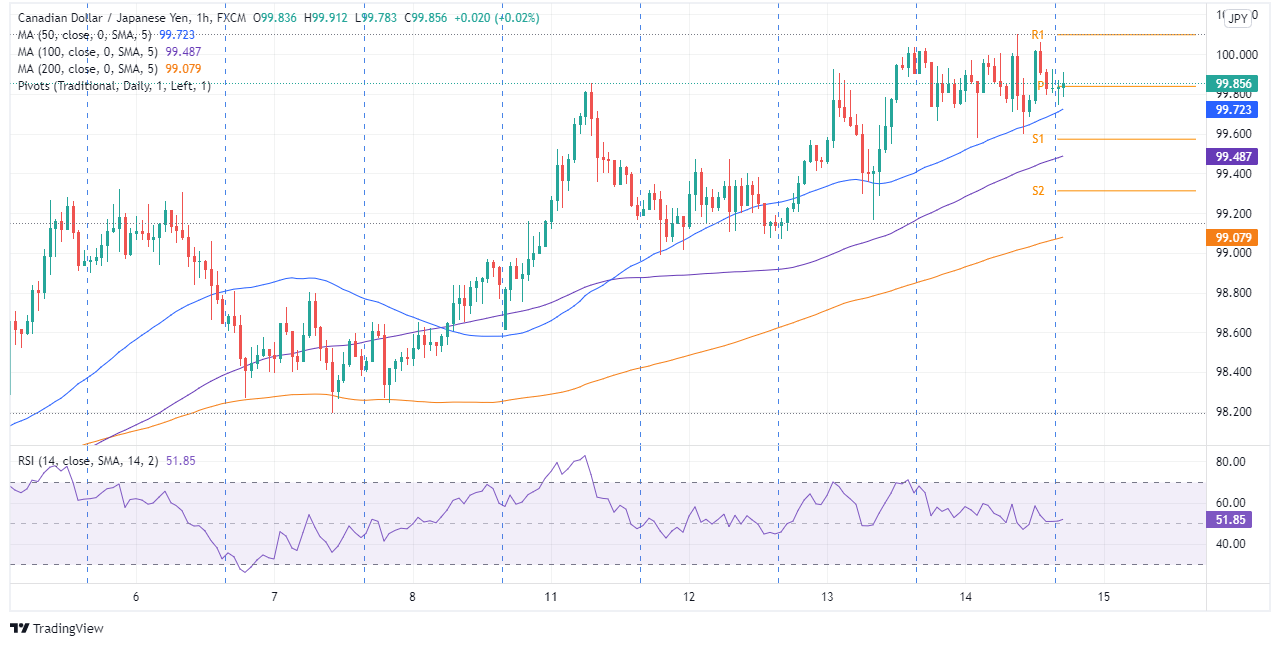
Meanwhile, the CAD/JPY 1-hour chart is also upward biased and remains trading above the 50-hour simple moving average (SMA) for the last three days, meaning that each time prices went down, the 50-SMA acted as a dynamic support. That said, the CAD/JPY first resistance would be the confluence of the April 14 cycle high and the R1 daily pivot around 100.10. A breach of the latter would expose the R2 pivot at 100.36 and then the R3 pivot at 100.62.

On the flip side, the CAD/JPY first support would be the 50-hour SMA at 99.72. Once cleared, it would open the door to significant demand zones, like the S1 daily pivot at 99.57, followed by the 100-hour SMA at 99.48.

CAD/JPY

Overview
Today last price 99.92
Today Daily Change 0.06
Today Daily Change % 0.06
Today daily open 99.87
 
Trends
Daily SMA20 97.66
Daily SMA50 93.57
Daily SMA100 91.75
Daily SMA200 90.22
 
Levels
Previous Daily High 100.06
Previous Daily Low 99.1
Previous Weekly High 99.33
Previous Weekly Low 97.62
Previous Monthly High 100.2
Previous Monthly Low 89.65
Daily Fibonacci 38.2% 99.69
Daily Fibonacci 61.8% 99.47
Daily Pivot Point S1 99.29
Daily Pivot Point S2 98.72
Daily Pivot Point S3 98.33
Daily Pivot Point R1 100.25
Daily Pivot Point R2 100.64
Daily Pivot Point R3 101.21


Share: Feed news

Information on these pages contains forward-looking statements that involve risks and uncertainties. Markets and instruments profiled on this page are for informational purposes only and should not in any way come across as a recommendation to buy or sell in these assets. You should do your own thorough research before making any investment decisions. FXStreet does not in any way guarantee that this information is free from mistakes, errors, or material misstatements. It also does not guarantee that this information is of a timely nature. Investing in Open Markets involves a great deal of risk, including the loss of all or a portion of your investment, as well as emotional distress. All risks, losses and costs associated with investing, including total loss of principal, are your responsibility. The views and opinions expressed in this article are those of the authors and do not necessarily reflect the official policy or position of FXStreet nor its advertisers. The author will not be held responsible for information that is found at the end of links posted on this page.

If not otherwise explicitly mentioned in the body of the article, at the time of writing, the author has no position in any stock mentioned in this article and no business relationship with any company mentioned. The author has not received compensation for writing this article, other than from FXStreet.

FXStreet and the author do not provide personalized recommendations. The author makes no representations as to the accuracy, completeness, or suitability of this information. FXStreet and the author will not be liable for any errors, omissions or any losses, injuries or damages arising from this information and its display or use. Errors and omissions excepted.

The author and FXStreet are not registered investment advisors and nothing in this article is intended to be investment advice.

Recommended content


Recommended content

Editors’ Picks

EUR/USD climbs to 10-day highs above 1.0700

EUR/USD climbs to 10-day highs above 1.0700

EUR/USD gained traction and rose to its highest level in over a week above 1.0700 in the American session on Tuesday. The renewed US Dollar weakness following the disappointing PMI data helps the pair stretch higher.

EUR/USD News

GBP/USD extends recovery beyond 1.2400 on broad USD weakness

GBP/USD extends recovery beyond 1.2400 on broad USD weakness

GBP/USD gathered bullish momentum and extended its daily rebound toward 1.2450 in the second half of the day. The US Dollar came under heavy selling pressure after weaker-than-forecast PMI data and fueled the pair's rally. 

GBP/USD News

Gold rebounds to $2,320 as US yields turn south

Gold rebounds to $2,320 as US yields turn south

Gold reversed its direction and rose to the $2,320 area, erasing a large portion of its daily losses in the process. The benchmark 10-year US Treasury bond yield stays in the red below 4.6% following the weak US PMI data and supports XAU/USD.

Gold News

Here’s why Ondo price hit new ATH amid bearish market outlook Premium

Here’s why Ondo price hit new ATH amid bearish market outlook

Ondo price shows no signs of slowing down after setting up an all-time high (ATH) at $1.05 on March 31. This development is likely to be followed by a correction and ATH but not necessarily in that order.

Read more

Germany’s economic come back

Germany’s economic come back

Germany is the sick man of Europe no more. Thanks to its service sector, it now appears that it will exit recession, and the economic future could be bright. The PMI data for April surprised on the upside for Germany, led by the service sector.

Read more

Forex MAJORS

Cryptocurrencies

Signatures