|

CAD/CHF stalling at resistance ahead of Canadian CPI and Retail Sales

  • Canadian CPI and Retail Sales are scheduled on Friday at 13.30 GMT.
  • CAD/CHF is in a compression pattern on the daily chart. 

The CAD/CHF cross is trading at around 0.7351 as Trump announced that he would impose tariffs on China worth $50-60 billion. China promised they would retaliate imposing tariffs as well on US goods, with escalating tensions about a trade word undermining financial markets. 

CAD/CHF daily chart:

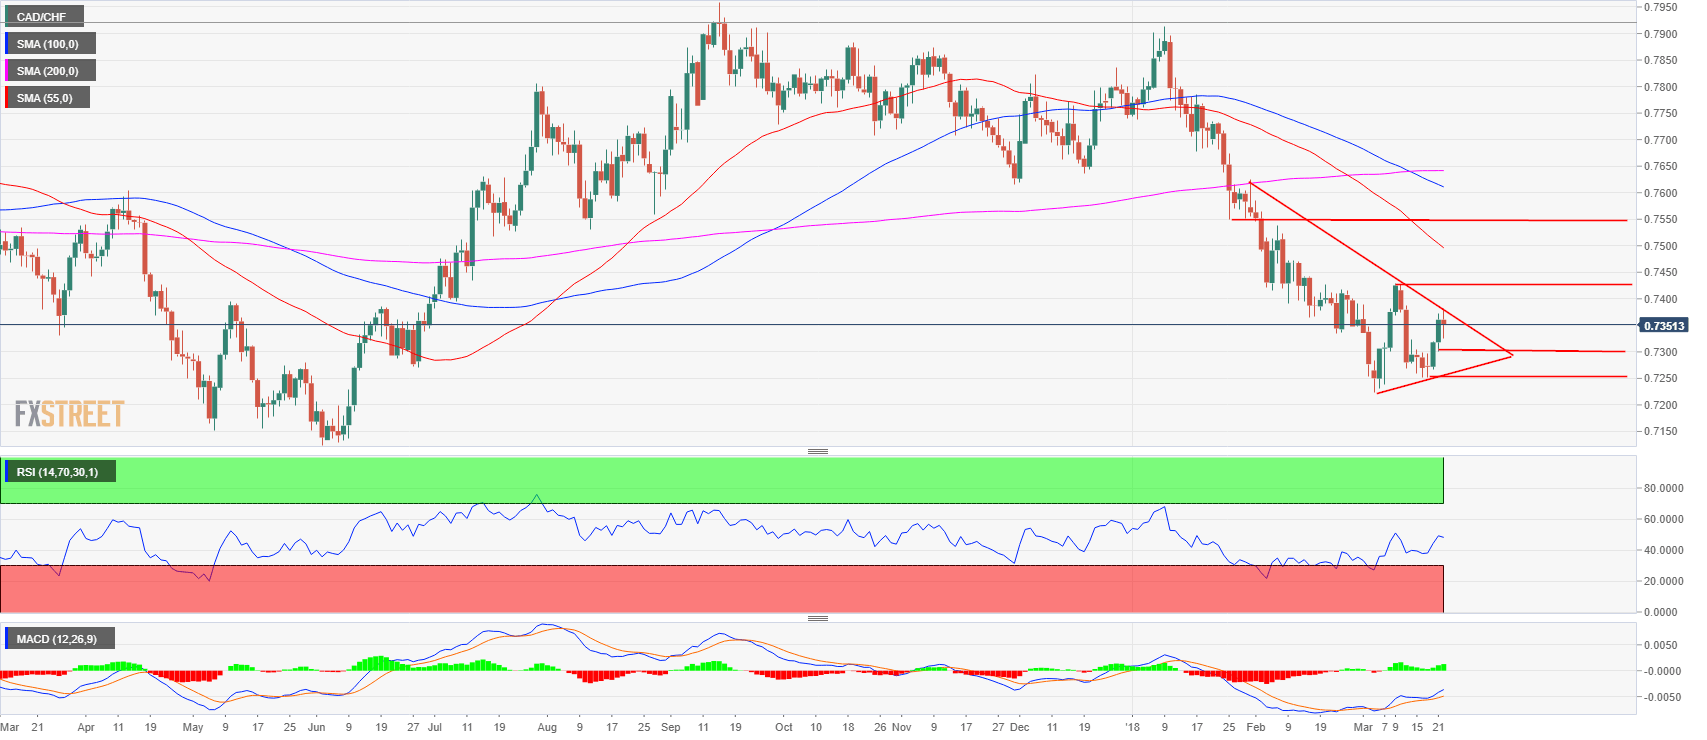
The CAD/CHF has formed a double bottom at the 0.7250 level and in the last four days, the cross gained almost 2%. While both the RSI and the MACD indicators are displaying a positive divergence there is still no significant bull run that would confirm that the bull reversal has taken place just yet. However, sellers have only owned the market on  March 12 and 13 with only two significant bear days, but after that, it was mainly buyers buying the dip which lead to the bull breakout of the last 3 days of trading. Technically the CAD/CHF has found resistance at the trendline after a three-day jump.  

Tomorrow will see Canadian CPI and retail sales releases. Any deviation can lead to a rather big reaction. A negative or neutral reading could see the cross back to 0.7300 support or even to 0.7250 in the coming days. On the flip side, if the bulls win, resistance is seen at 0.7430 previous swing high, followed by the 0.7550 supply zone. No Swiss macro-data is expected in the next 24 hours. Also worth noting is the potential wedge formation which is taking shape in the daily chart

CAD/CHF 1-hour chart:

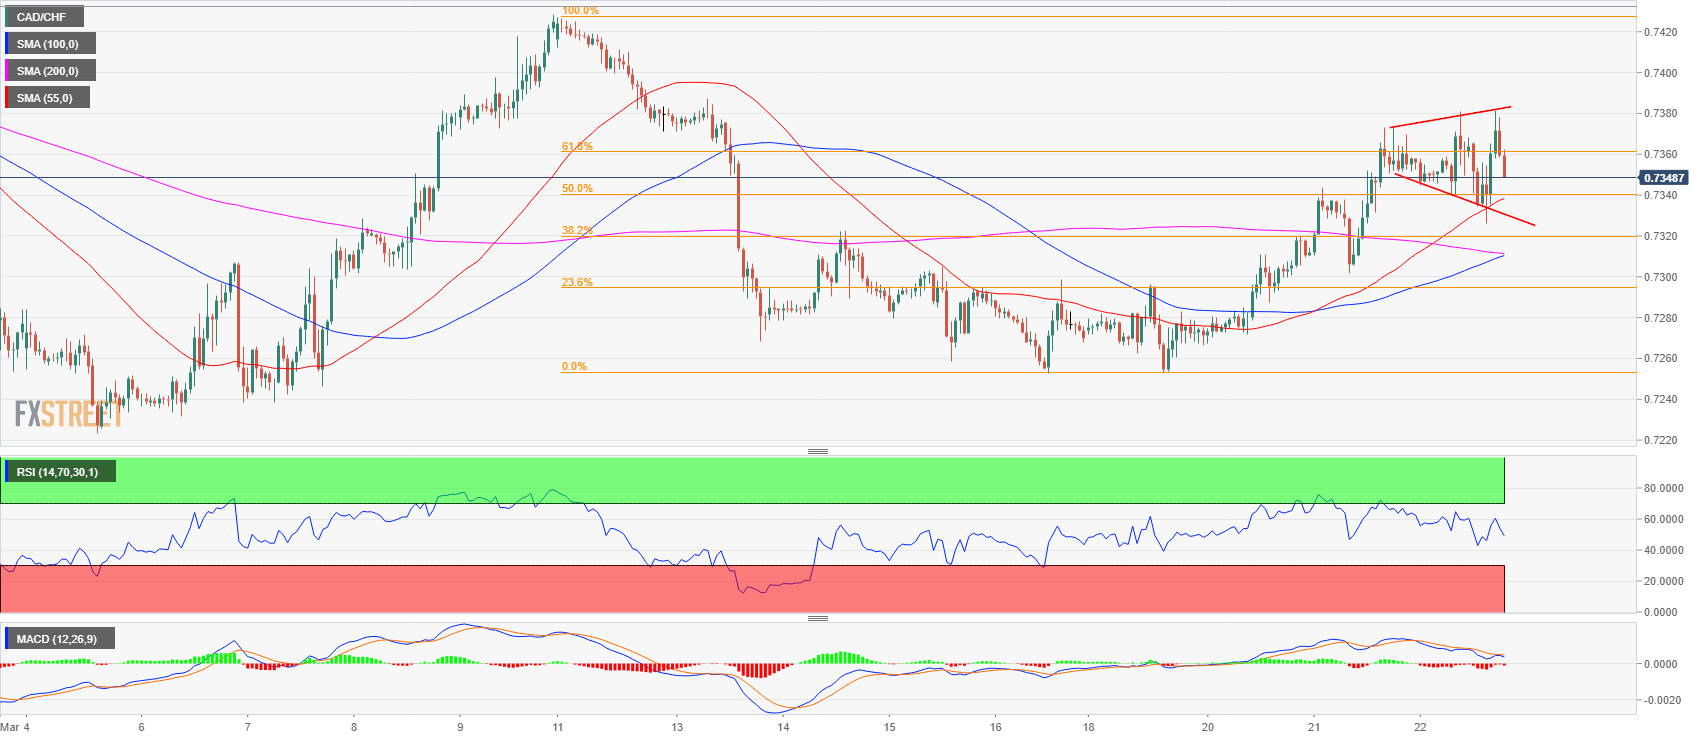
The 1-hour chart is displaying an expanding triangle formation which often leads to substantial move once the pattern is broken. MACD would suggest that a correction down is underway. 

Author

Flavio Tosti

Flavio Tosti

Independent Analyst


More from Flavio Tosti
Share:

Editor's Picks

EUR/USD remains offered below 1.1600, seems vulnerable near multi-month low

The EUR/USD pair struggles to capitalize on the overnight bounce from the 1.1530 region, or the lowest level since November 2025, and lower for the third consecutive day on Wednesday. Spot prices slide back below the 1.1600 mark during the Asian session and seem vulnerable to slide further.

GBP/USD slips below key averages as geopolitical risks mount

GBP/USD fell about 0.35% on Tuesday, settling around 1.3350 after slipping below the 200-day Exponential Moving Average for the first time since early December. The pair has pulled back sharply from its late-January high near 1.3870, shedding over 500 pips in a series of lower highs and lower lows. 

Gold rebounds ahead of US ADP, will it last?

Gold finds renewed Asian bids and retests $5,230 early Wednesday after the heavy sell-off on Tuesday. The US Dollar stands tall amid escalating Middle East tensions and reduced dovish Fed expectations. Gold defends $5,000 or 50% Fibo level after facing rejection at the 78.6% Fibo resistance at $5,342 amid bullish RSI.  

Bitcoin, Ethereum and Ripple struggle for direction as consolidation persists

Bitcoin, Ethereum and Ripple prices trade with a cautious tone at the time of writing on Wednesday as upside momentum continues to fade across the broader crypto market. BTC remains within a parallel channel, ETH struggles below key resistance, while XRP remains fragile within a descending channel. These top three cryptocurrencies by market capitalization continue to struggle to establish a directional bias amid the consolidation phase.

Energy shock 2.0: Why rising Gas prices could hit the Euro

Even without a confirmed, sustained disruption, the mere risk to a key global energy chokepoint is enough to inject a significant premium into European Gas markets. And for the Euro, that matters.

Ripple falters amid sell-off jitters and negative funding rates

Ripple (XRP) has come under pressure, drifting lower to $1.35 at the time of writing on Tuesday. The over 2% correction looks poised to erase the previous day’s gains, which lifted the remittance token to $1.42.