CAC 40 (France) Index Elliott Wave technical analysis [Video]
![CAC 40 (France) Index Elliott Wave technical analysis [Video]](https://editorial.fxsstatic.com/images/i/Economic-Indicator_Recession-5_XtraLarge.png)
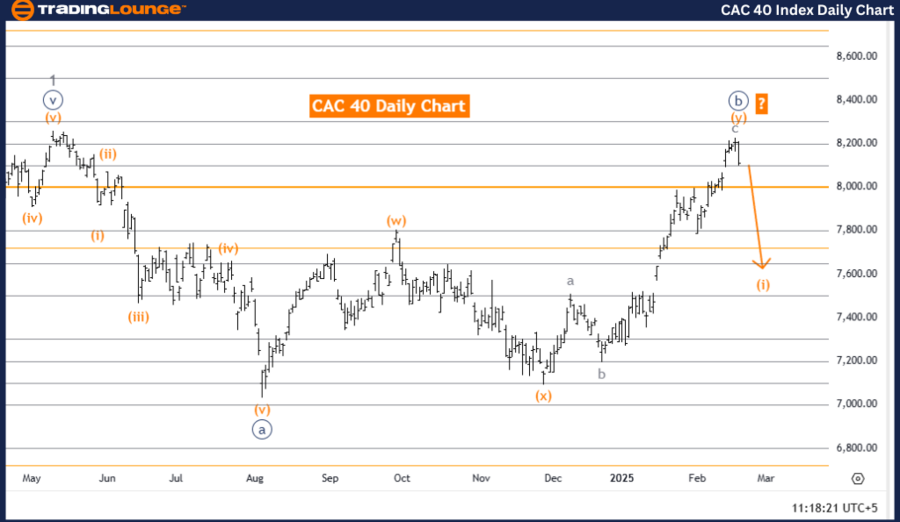
CAC 40 (France) Elliott Wave Analysis - Trading Lounge Day Chart.
CAC 40 (France) Elliott Wave technical analysis
-
Function: Counter Trend.
-
Mode: Impulsive.
-
Structure: Orange Wave 1.
-
Position: Navy Blue Wave C.
-
Next lower degree direction: Orange Wave 1 (Started).
The CAC 40 (France) Elliott Wave Analysis for the daily chart suggests a counter-trend movement. This analysis is based on Elliott Wave Theory, which identifies repetitive wave patterns in price movements.
The current market mode is impulsive, indicating a strong directional movement. The price structure is identified as Orange Wave 1, which is part of a larger Navy Blue Wave C. This signals that the market is in a corrective phase, with Orange Wave 1 of Navy Blue Wave C currently active.
The analysis highlights that Navy Blue Wave B appears completed, and Orange Wave 1 of Navy Blue Wave C has now started. Typically, Navy Blue Wave C is the final wave in a corrective sequence, and Orange Wave 1 marks the beginning of this phase. The lower-degree Orange Wave 1 is now in progress, confirming the continuation of the corrective movement.
Conclusion
The CAC 40 daily chart analysis indicates a counter-trend movement, with Orange Wave 1 of Navy Blue Wave C currently unfolding. The completion of Navy Blue Wave B and the activation of Orange Wave 1 signal the beginning of a corrective phase.
Traders should monitor Orange Wave 1 closely, as it will provide insights into the strength and sustainability of the corrective trend. This analysis presents a cautious outlook for CAC 40, and traders may use this information to guide their trading strategies. The ongoing impulsive wave structure suggests that the market is likely to maintain its corrective trajectory in the near term.
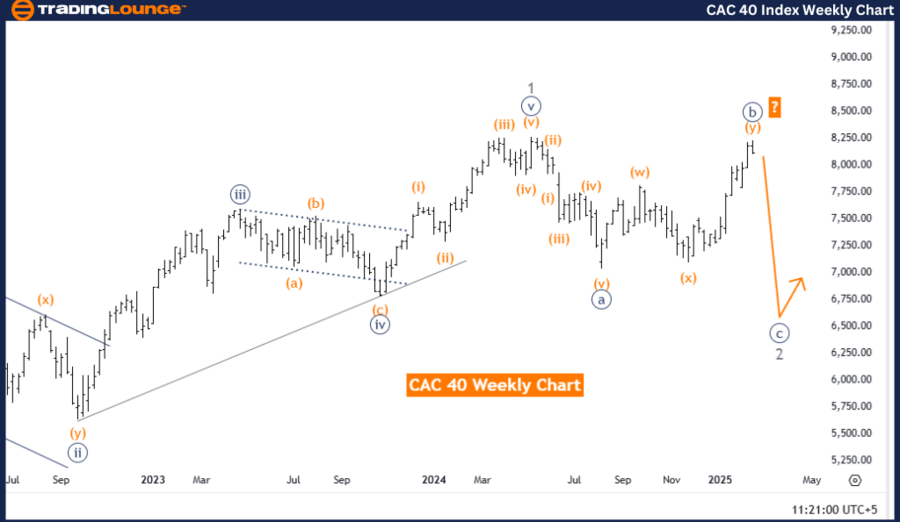
CAC 40 (France) Elliott Wave Analysis - Trading Lounge Weekly Chart.
CAC 40 (France) Elliott Wave technical analysis
-
Function: Counter Trend.
-
Mode: Impulsive.
-
Structure: Navy Blue Wave C.
-
Position: Gray Wave 2.
-
Next lower degree direction: Navy Blue Wave C (Started).
The CAC 40 (France) Elliott Wave Analysis for the weekly chart suggests a counter-trend movement. This analysis is based on Elliott Wave Theory, which identifies repetitive wave structures in price movements.
The current market mode is impulsive, indicating a strong directional move. The price structure is identified as Navy Blue Wave C, which is part of a larger corrective sequence, signaling that the market is in a corrective phase, with Navy Blue Wave C currently active.
The analysis highlights that Navy Blue Wave B appears completed, and Navy Blue Wave C is now in progress. Typically, Wave C is the final phase in a corrective sequence, often characterized by strong downward or sideways movement, depending on the market context. With Navy Blue Wave C now started, the corrective trend is expected to continue.
Conclusion
The CAC 40 weekly chart analysis indicates a counter-trend movement, with Navy Blue Wave C currently unfolding. The completion of Navy Blue Wave B and the activation of Navy Blue Wave C confirm the continuation of the corrective phase.
Traders should monitor the development of Navy Blue Wave C closely, as it will provide insights into the strength and sustainability of the corrective trend. This analysis presents a cautious outlook for CAC 40, and traders can use it to inform their trading strategies. The ongoing impulsive wave structure suggests that the market is likely to maintain its corrective trajectory in the near term.
This phase is critical for identifying potential reversals or trend continuations, making it an essential period for market participants.
Technical analyst: Malik Awais.
CAC 40 (France) Elliott Wave technical analysis [Video]
Author

Peter Mathers
TradingLounge
Peter Mathers started actively trading in 1982. He began his career at Hoei and Shoin, a Japanese futures trading company.


