|
Brent Technical Analysis: Bearish 4H RSI divergence invalidated
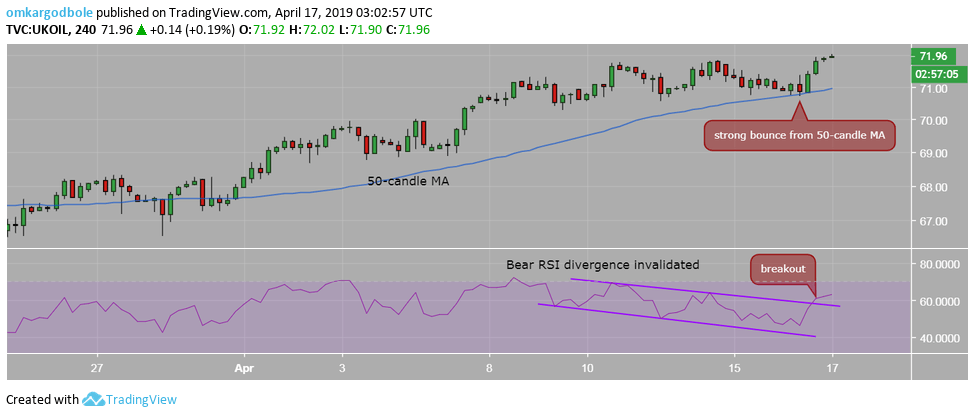
- Brent oil dropped to 4-hour chart 50-candle moving average (MA) yesterday, as expected, only to stage a strong bounce and close above $71.70 engulfing Monday's price action.
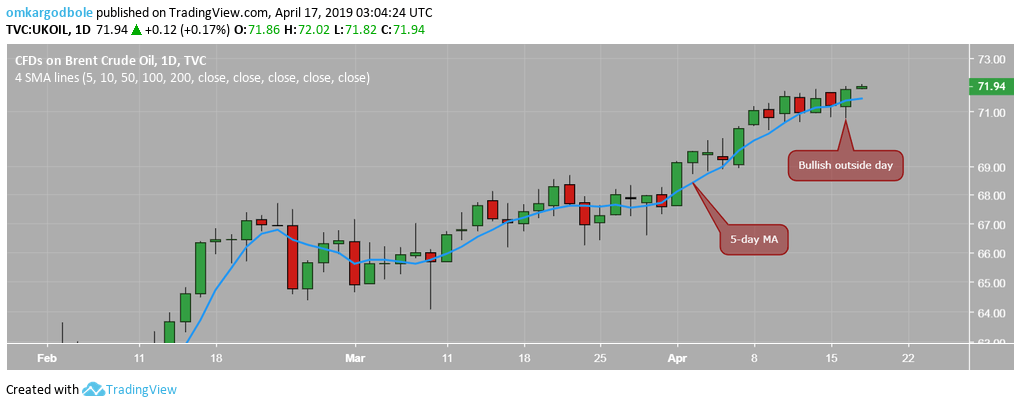
- The resulting bullish outside day candle is a bullish continuation pattern and has invalidated the bearish divergence of the 4-hour chart relative strength index (RSI).
- More importantly, the indicator has violated the lower highs (bearish divergence) with a falling channel breakout.
- Brent, therefore, could rise to $72.80 (61.8 percent Fibonacci retracement of $86.71/$50.29).
- The bullish case, however, would weaken if the prices fall back below the 5-day moving average (MA), currently at $71.50.

Author

Omkar Godbole
FXStreet Contributor
Omkar Godbole, editor and analyst, joined FXStreet after four years as a research analyst at several Indian brokerage companies.
More from Omkar Godbole


