BP Technical Analysis: BP trading

BP Technical Analysis Summary
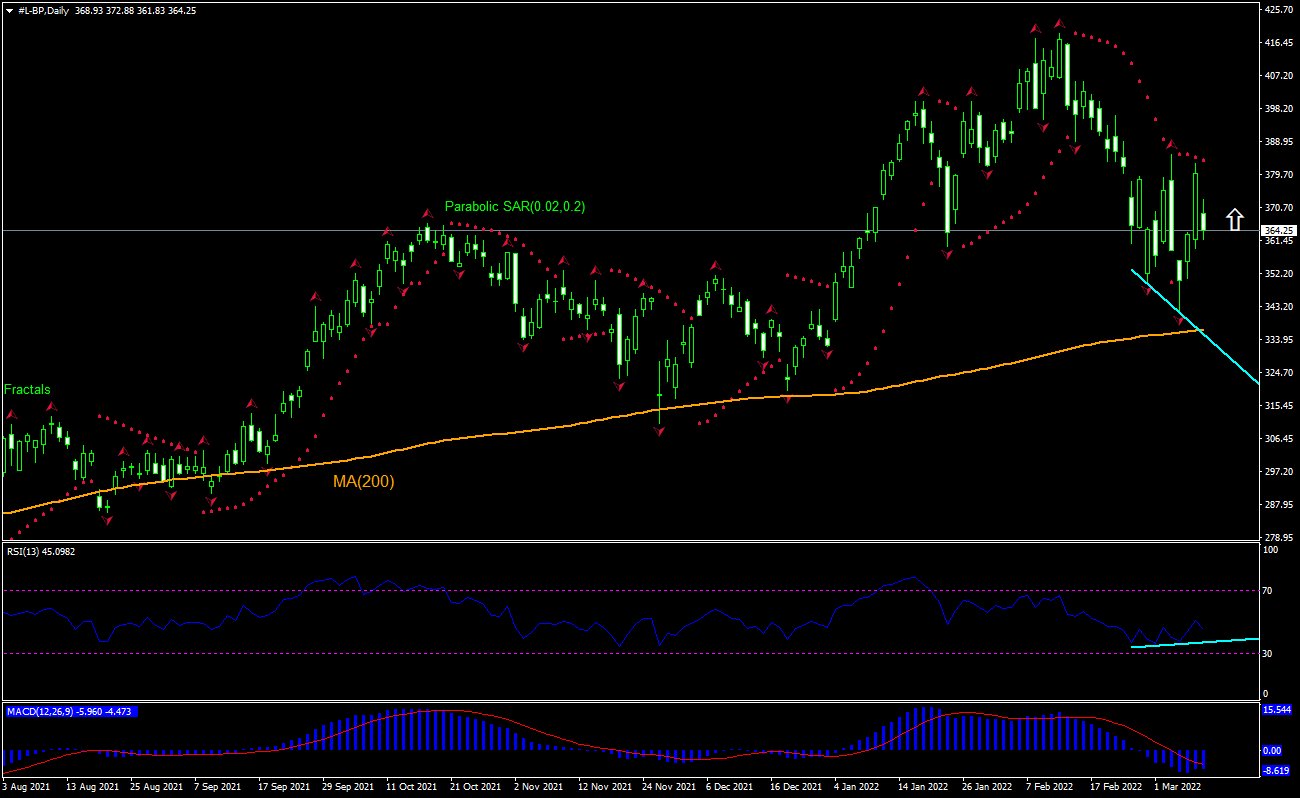
Buy Stop։ Above 385.35
Stop Loss: Below 340.52
| Indicator | Signal |
| RSI | Buy |
| MACD | Buy |
| MA(200) | Buy |
| Fractals | Sell |
| Parabolic SAR | Sell |
BP Chart Analysis
BP Technical Analysis
The technical analysis of the BP stock price chart in daily timeframe shows #L-BP, Daily is retracing down toward the 200-day moving average MA(200) while the RSI indicator has formed a bullish convergence We believe the bullish momentum will continue after the price breaches above the last fractal high at 385.35. This level can be used as an entry point for placing a pending order to buy. The stop loss can be placed below the fractal low at 340.52. After placing the order, the stop loss is to be moved every day to the next fractal low, following Parabolic indicator signals. Thus, we are changing the expected profit/loss ratio to the breakeven point. If the price meets the stop loss level (340.52) without reaching the order (385.35), we recommend cancelling the order: the market has undergone internal changes which were not taken into account.
Fundamental Analysis of Stocks - BP
BP stock edged down after a report the company had no buyer for its Rosneft stake in Russia. Will the BP stock price continue retreating?
BP plc is a British publicly traded multinational oil and gas company. It is one of the largest oil and gas companies in the world. Company’s market capitalization is at £70.79 billion. BP stock is trading at P/E Ratio (Trailing Twelve Months) of 13.73. The company earned £156.43 billion revenue (ttm) and a Return on Assets (ttm) of 2.37% and a Return on Equity (ttm) of 9.64%. BP announced on February 28 it was immediately exiting the state-owned Rosneft stake in Russia at a cost of up to $25 billion after the start of Russia invasion of Ukraine. On Tuesday BP executives confirmed BP had no buyer for the Rosneft stake. The stock price dipped 2.2% on day after the news. The company is facing a large writedown as it will lose a large revenue stream: BP received a $640 million dividend last year from Rosneft, totaling $4 billion in dividends since 2013. Declining earnings are bearish for a company stock. However, the technical setup is bullish for BP stock price.
Want to get more free analytics? Open Demo Account now to get daily news and analytical materials.
Author

Dmitry Lukashov
IFC Markets
Dimtry Lukashov is the senior analyst of IFC Markets. He started his professional career in the financial market as a trader interested in stocks and obligations.


