Bovespa Index Elliott Wave technical analysis [Video]
![Bovespa Index Elliott Wave technical analysis [Video]](https://editorial.fxsstatic.com/images/i/charts-01_XtraLarge.jpg)
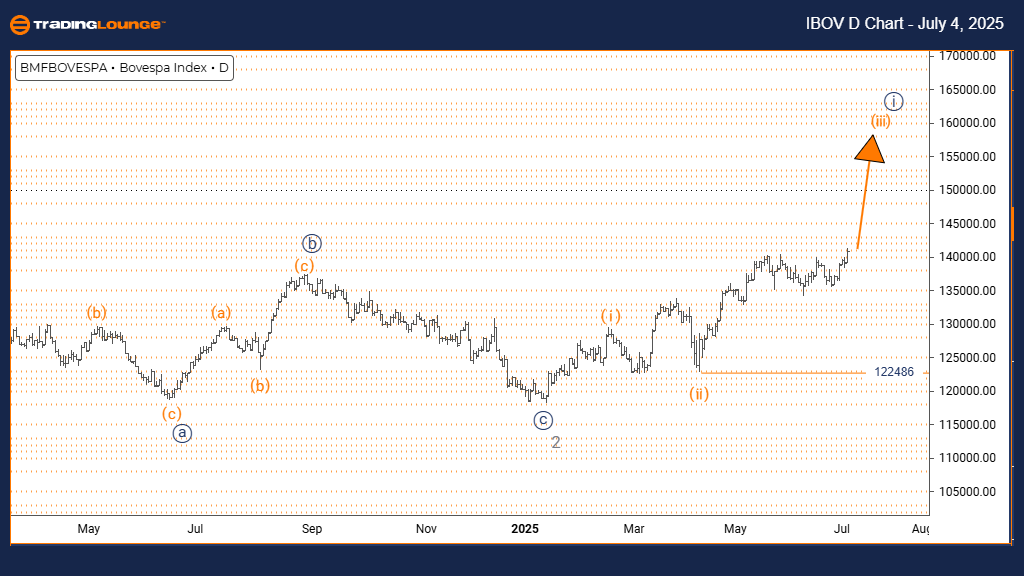
Bovespa Index Elliott Wave analysis – Daily chart
-
Function: Bullish Trend.
-
Mode: Impulsive.
-
Structure: Orange Wave 3.
-
Position: Navy Blue Wave 1.
-
Direction next lower degrees: Orange Wave 4.
-
Details: Orange Wave 2 appears complete; Orange Wave 3 now unfolding.
-
Wave cancel invalidation level: 122486.
The Bovespa Index daily chart analysis confirms a bullish Elliott Wave structure, with the price currently progressing through orange wave 3, part of the broader navy blue wave 1 sequence. This phase suggests strong upward movement in the early stages of a bullish market cycle.
Having completed orange wave 2, the index has entered orange wave 3, known for being the most powerful and extended wave in an Elliott sequence. The expected follow-up move at a lower degree is orange wave 4, which would act as a corrective phase after the current upward trend.
Traders should keep an eye on the invalidation level at 122486. A move below this level would nullify the current wave count. Until then, the structure indicates continued bullish potential with a high probability of price appreciation in the near term.
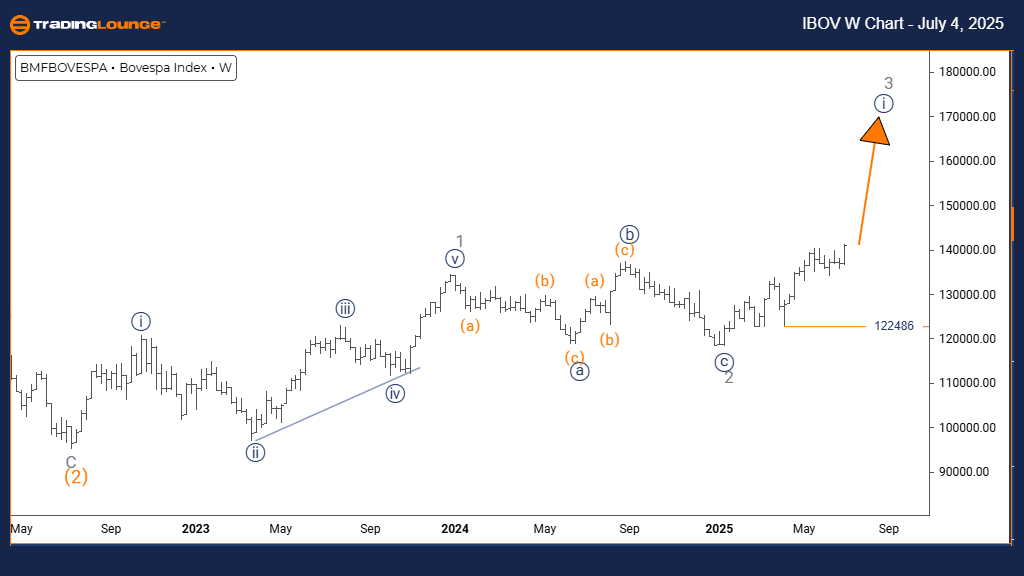
Elliott Wave technical analysis – Weekly chart
-
Function: Bullish Trend.
-
Mode: Impulsive.
-
Structure: Navy Blue Wave 1.
-
Position: Gray Wave 3.
-
Direction next lower degrees: Navy Blue Wave 2.
-
Details: Gray Wave 2 is complete; Navy Blue Wave 1 of Gray Wave 3 is now developing.
-
Wave cancel invalidation level: 122486.
On the weekly chart, the Bovespa Index continues to reflect a strong bullish trend, with price action building into navy blue wave 1, part of a broader gray wave 3 sequence. This marks the initial leg of what could be a significant rally in the coming weeks.
With gray wave 2 finalized, the transition into navy blue wave 1 signals growing buying momentum. This wave represents the start of a third wave sequence — typically the strongest and most aggressive in Elliott Wave theory.
A critical support zone is the wave invalidation level at 122486. As long as this level holds, the structure supports a sustained bullish move. Investors should monitor wave developments as the market positions for potential long-term gains within gray wave 3.
Bovespa Index Elliott Wave technical analysis [Video]
Author

Peter Mathers
TradingLounge
Peter Mathers started actively trading in 1982. He began his career at Hoei and Shoin, a Japanese futures trading company.


