Boeing (BA stock) technical analysis

Boeing technical analysis summary
Buy Stop։ Above 183.31
Stop Loss: Below 174.45
| Indicator | Signal |
| RSI | Neutral |
| MACD | Buy |
| Donchian Channel | Neutral |
| MA(200) | Sell |
| Fractals | Buy |
| Parabolic SAR | Buy |
Boeing chart analysis
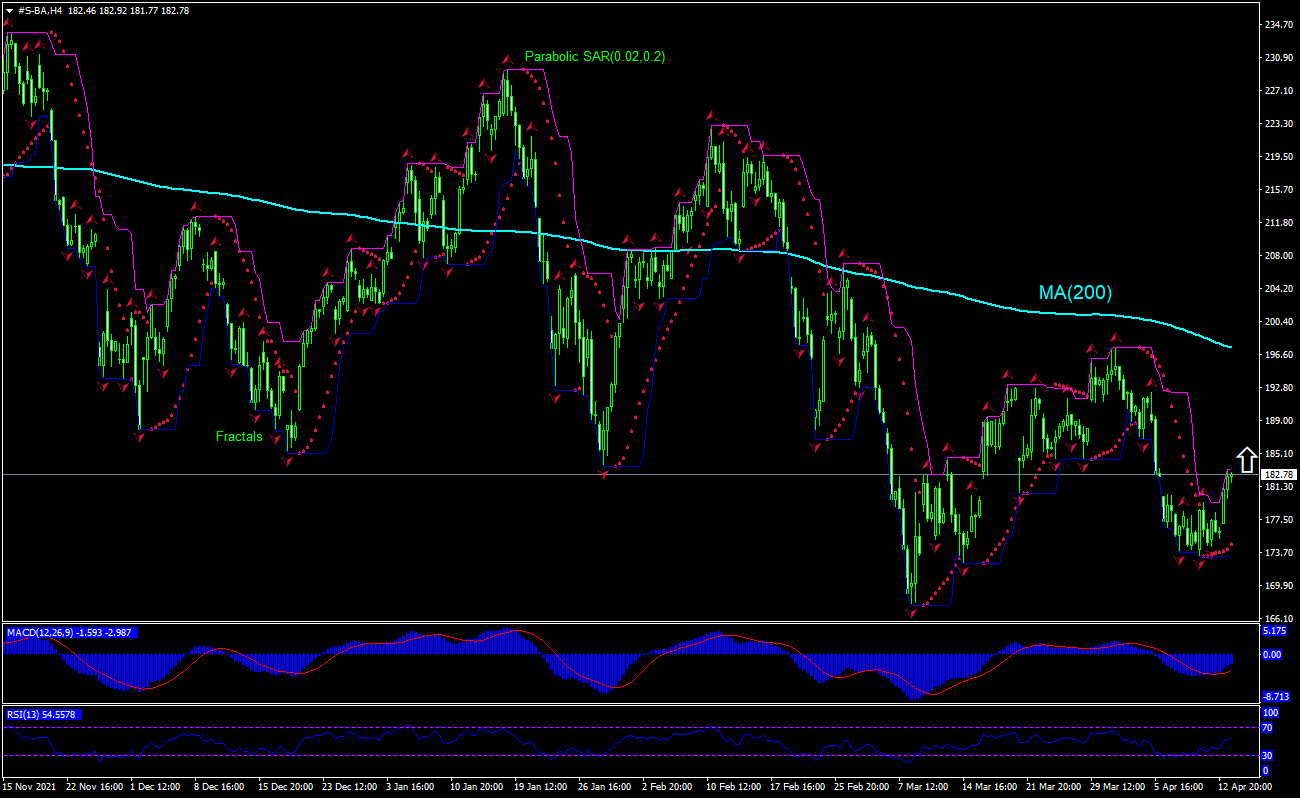
The technical analysis of the Boeing stock price chart on 4-hour timeframe shows #S-BA,H4 is rebounding toward the 200-period moving average MA(200) after hitting one-month low two days ago. We believe the bullish momentum will continue after the price breaches above the upper boundary of Donchian channel at 183.31. This level can be used as an entry point for placing a pending order to buy. The stop loss can be placed below the lower boundary of Donchian channel at 174.45. After placing the order, the stop loss is to be moved every day to the next fractal low, following Parabolic indicator signals. Thus, we are changing the expected profit/loss ratio to the breakeven point. If the price meets the stop loss level (229.48) without reaching the order (192.42), we recommend cancelling the order: the market has undergone internal changes which were not taken into account.
Fundamental analysis of stocks - Boeing
Boeing reported it removed over 100 plane orders from its backlog list as doesn’t expect them to be delivered. Will the Boeing stock price continue retreating?
The Boeing Company said it moved orders for 141 of its airplanes into accounting limbo due to the war in Ukraine, meaning it no longer expects the jets to be delivered. The orders were mainly for Russian carriers. Expectations of lower production are bearish for a company’s stock price. At the same time Boeing reported plane deliveries nearly doubled in March – to 41 from the 22 it delivered in February, and up from 29 a year ago. It cited rebounding travel and cargo demand. Boeing said year-to-date deliveries stood at 95 aircraft. For the first three months of the year Boeing's orders, net of canceled orders or swapped models, rose to 145 from 107. Rebounding demand for aircrafts is an upside risk for Boeing stock.
Want to get more free analytics? Open Demo Account now to get daily news and analytical materials.
Want to get more free analytics? Open Demo Account now to get daily news and analytical materials.
Author

Dmitry Lukashov
IFC Markets
Dimtry Lukashov is the senior analyst of IFC Markets. He started his professional career in the financial market as a trader interested in stocks and obligations.


