Bloodstock
S2N spotlight
A few weeks ago, I got approached by a guy launching a Bloodstock hedge fund. He asked if he could come and see me. I looked at his pedigree, and he had some serious institutional trading background and some interesting partners. I said, sure.
I thought he was in biotech selling blood plasma or something like that. It turns out he runs a prostitution, I mean, stud business.
There are a lot of similarities to the investing business. Here are 4 incredible recent purchases with massive exits. I am clearly sharing the best type of outcomes; finding these rare exceptions is extremely difficult and low probability.
You might be wondering why Berman is sharing this. The reason I am sharing this is because this is very much like the financial markets. If you only invest in stocks that are potentially going to the moon, then you are likely to explode trying. You need some stability in your portfolio.
The number one objective any trader or investor should have is to stay in the game. If moonshots are your thing, that is fine; you just need to balance your portfolio with a high degree of certainty. Finding that balance is the art of successful investing.
S2N observations
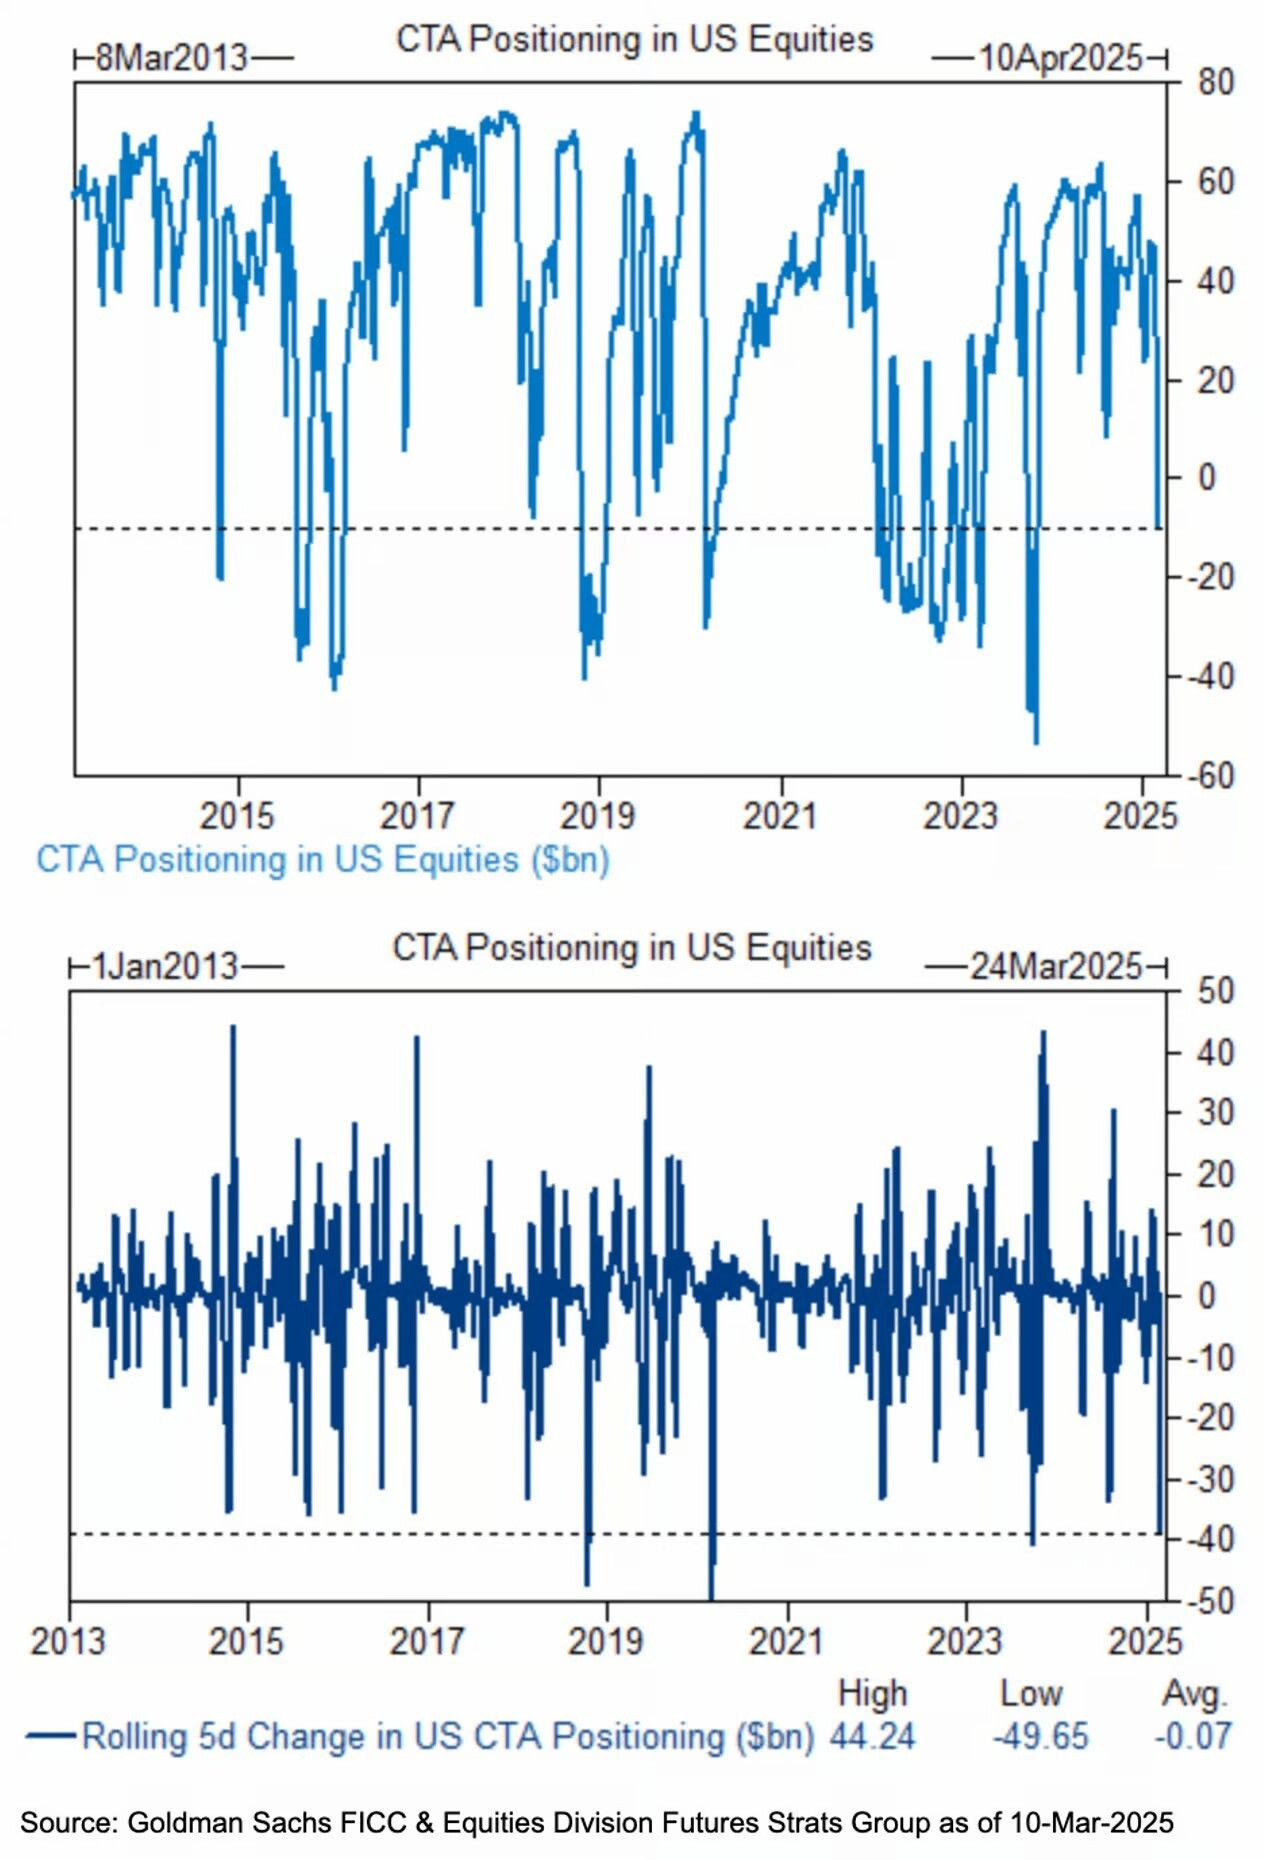
CTAs vs. US equities. "We have CTAs modeled SHORT -$10bn of US equities after selling -$39bn in the last 5 sessions. There have only been 15 other instances of similar/greater magnitude in our dataset. Outside of three bouts in 2023, they all occurred in 2018 and 2020." This is what Goldman Sachs reported overnight.
If you think you are playing on an even playing field, think again. Look at the proprietary advantage a company like Goldman Sachs has by being able to see how the traders and investors using their prime broking services are positioned. All in real time.
My mother called me this morning to ask me why Elon Musk was crying. I said, wouldn’t you be if you were half as rich as you were a few months ago, working a 100-hour week, and not drawing a salary from the government?
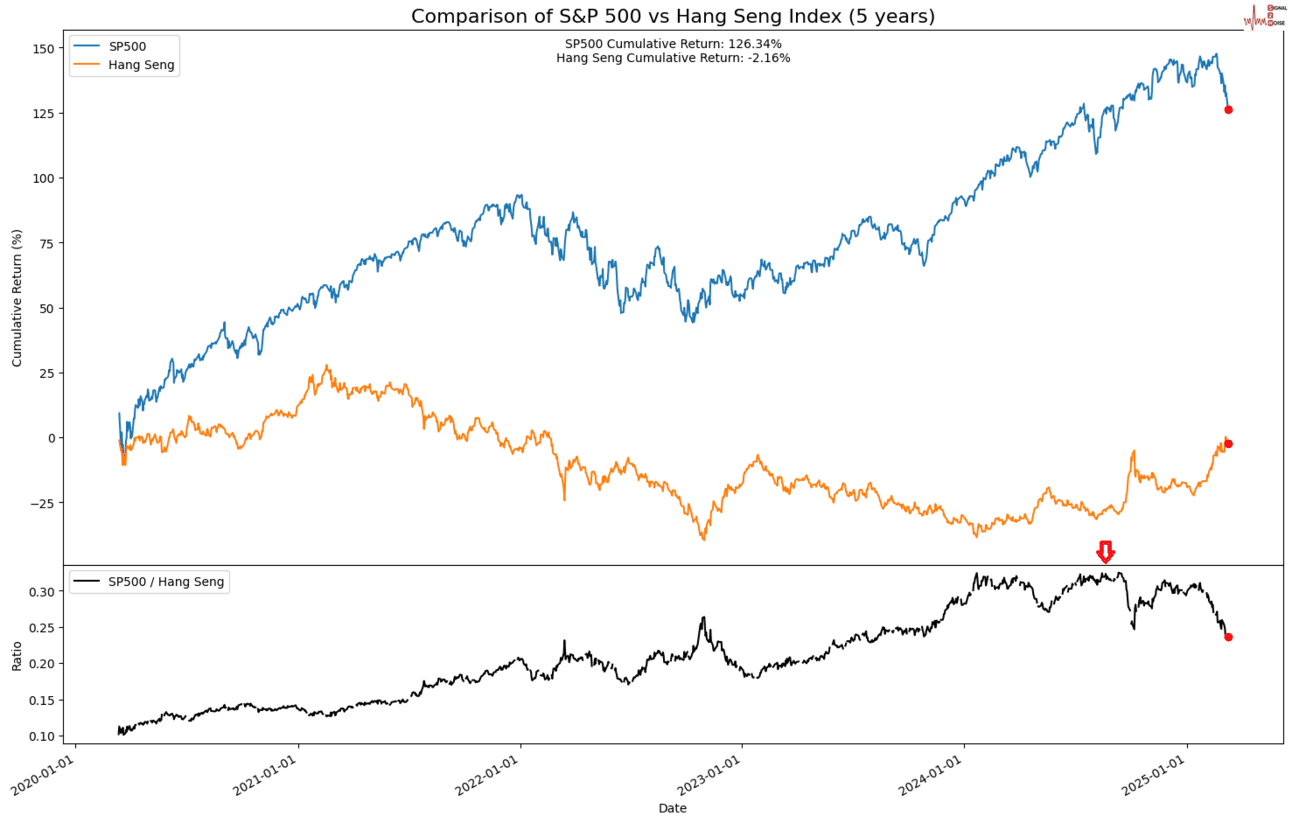
The trade I have been calling for many months is starting to pay off handsomely after nearly getting stopped out. Long Hang Seng, Short US. The red down arrow on the ratio pane at the bottom was our entry point. There is more to run on this I believe.
S2N screener alert
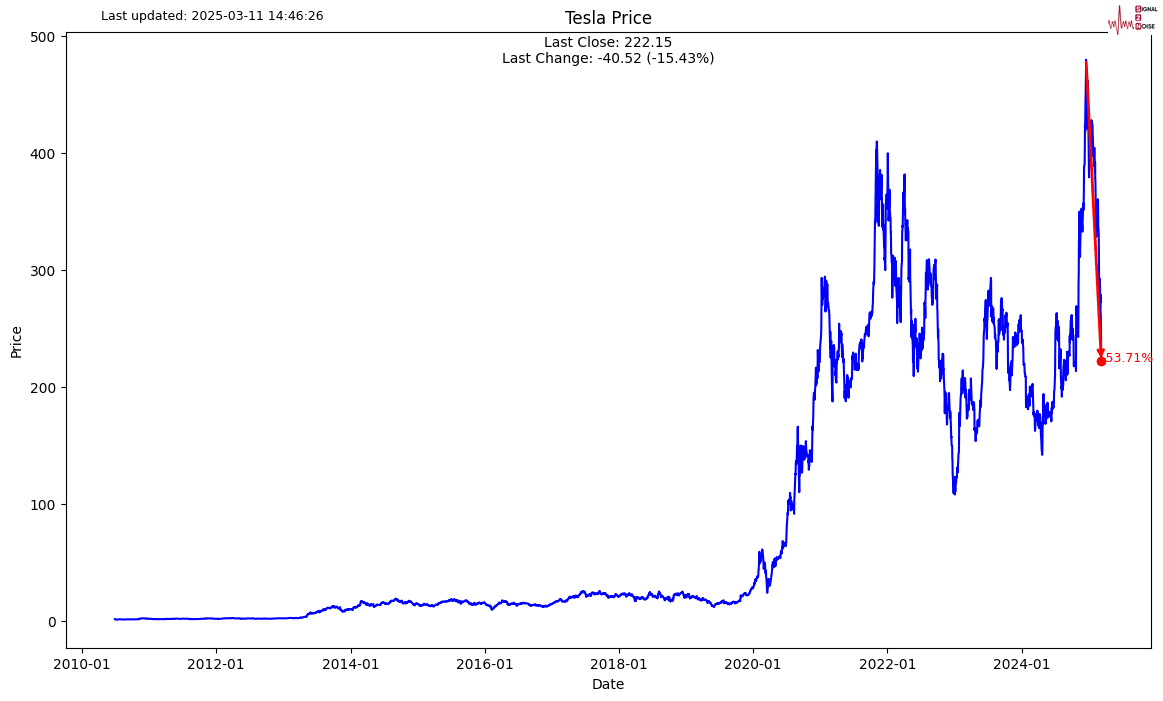
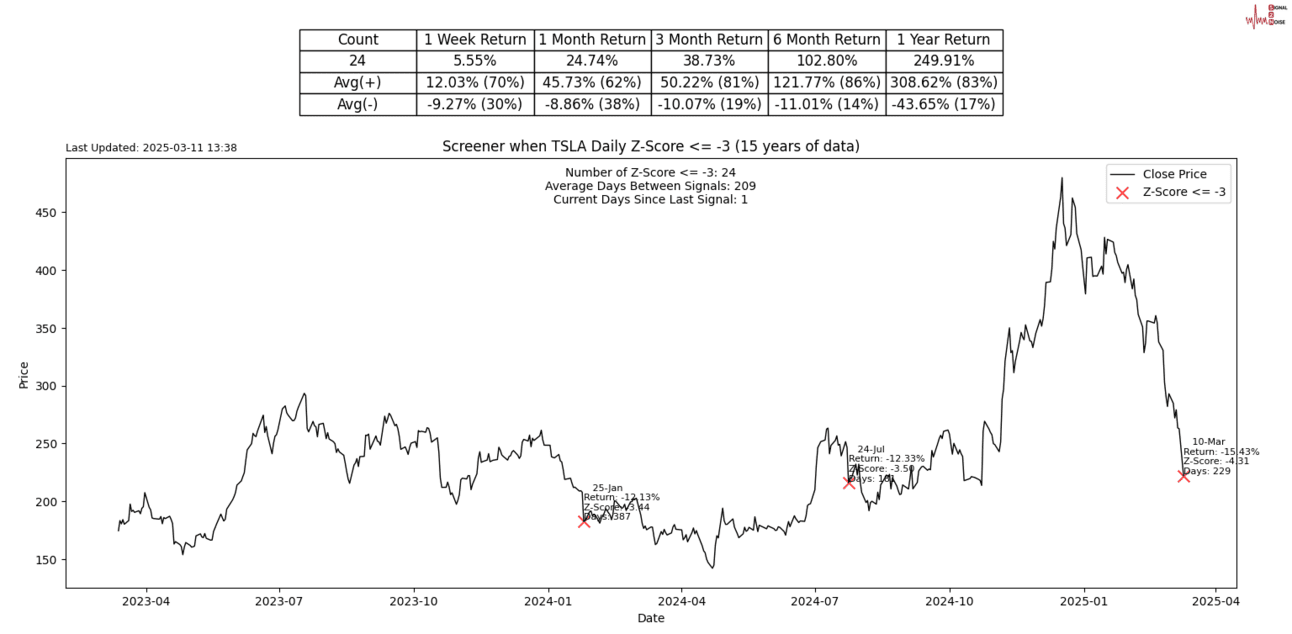
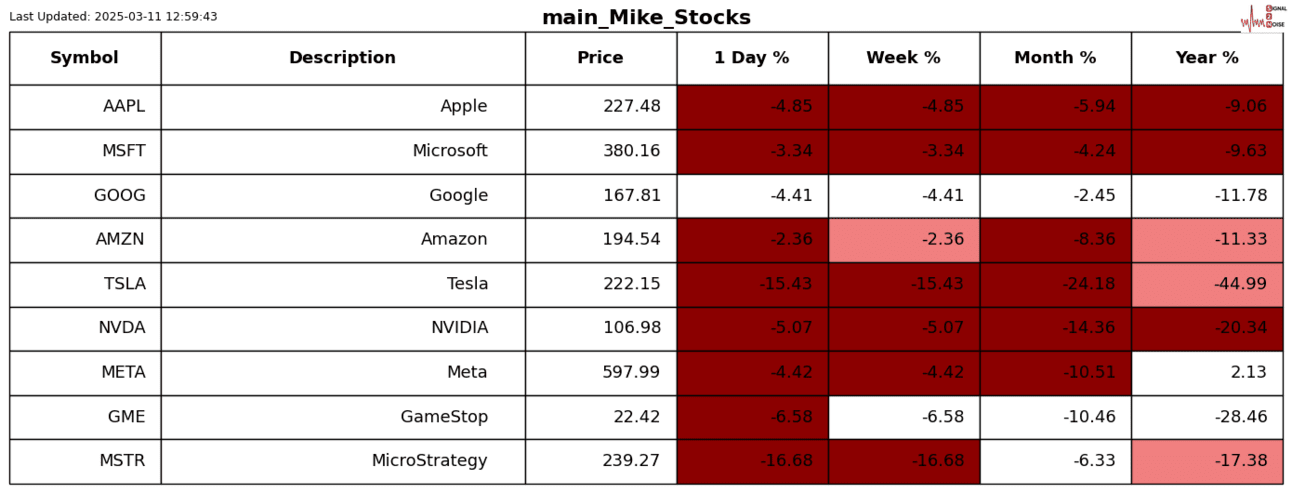
Tesla had a -4 sigma down day over -15%.
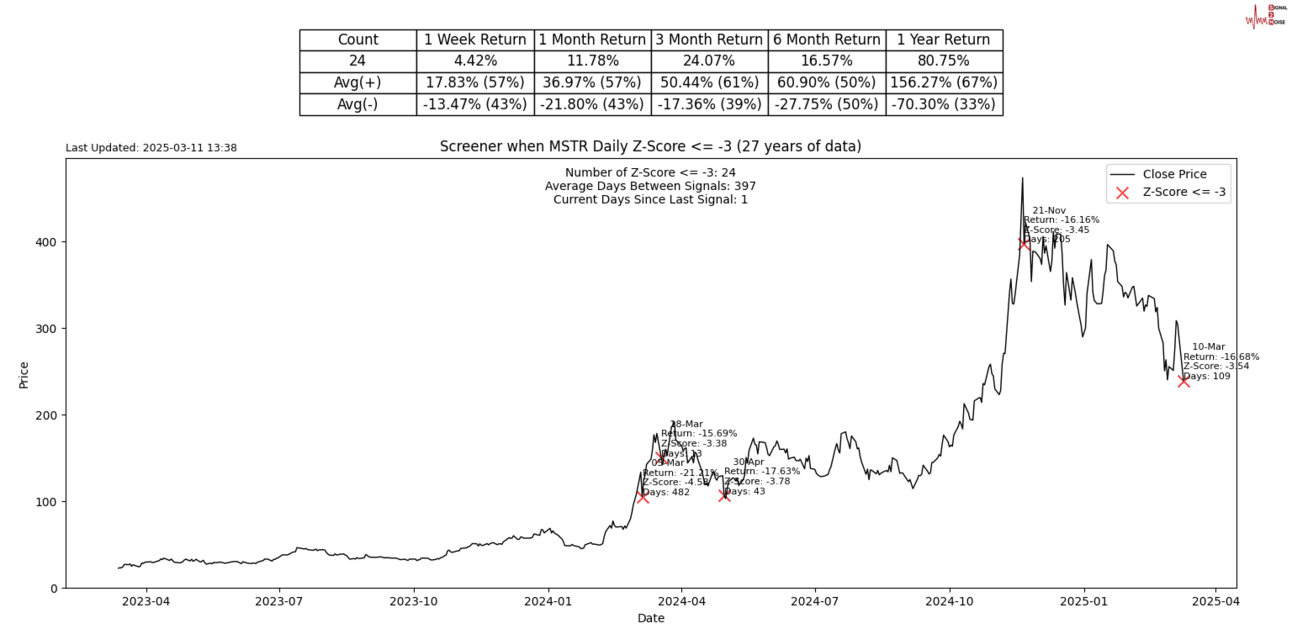
MicroStrategy was down more than -3 sigma and -16%.
S2N performance review

S2N chart gallery
S2N news today
Author

Michael Berman, PhD
Signal2Noise (S2N) News
Michael has decades of experience as a professional trader, hedge fund manager and incubator of emerging traders.


