Berkshire Hathaway Inc. (BRK.B) Elliott Wave technical analysis [Video]
![Berkshire Hathaway Inc. (BRK.B) Elliott Wave technical analysis [Video]](https://editorial.fxstreet.com/images/i/bullish-chart_XtraLarge.png)
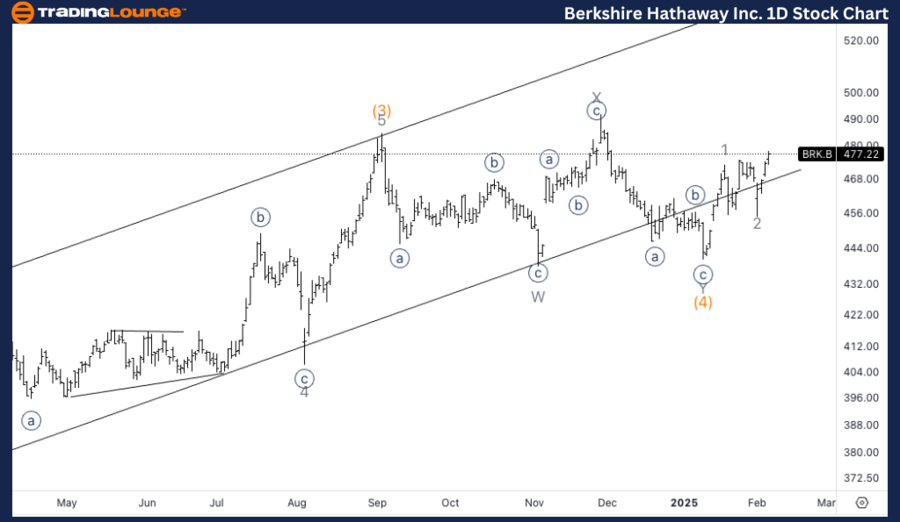
BRK.B Elliott Wave technical analysis
Function: Trend.
Mode: Impulsive.
Structure: Motive.
Position: Wave 3 of (5).
Direction: Upside within wave (5).
Details: Looking for intermediate wave (5) to slowly unfold higher as we approach Trading Level 5 at 500$. Equality of (5) vs. (1) stands at 543$ suggesting there is upside room.
BRK.B Elliott Wave technical analysis – Daily chart
Berkshire Hathaway Inc. (BRK.B) is currently unfolding in an impulsive trend structure within wave 3 of (5). We are anticipating intermediate wave (5) to continue its gradual climb higher, targeting the TradingLevel5 at $500. There is further potential for upside, with the equality of wave (5) vs. wave (1) projected at $543, indicating significant room for growth as wave (5) progresses.
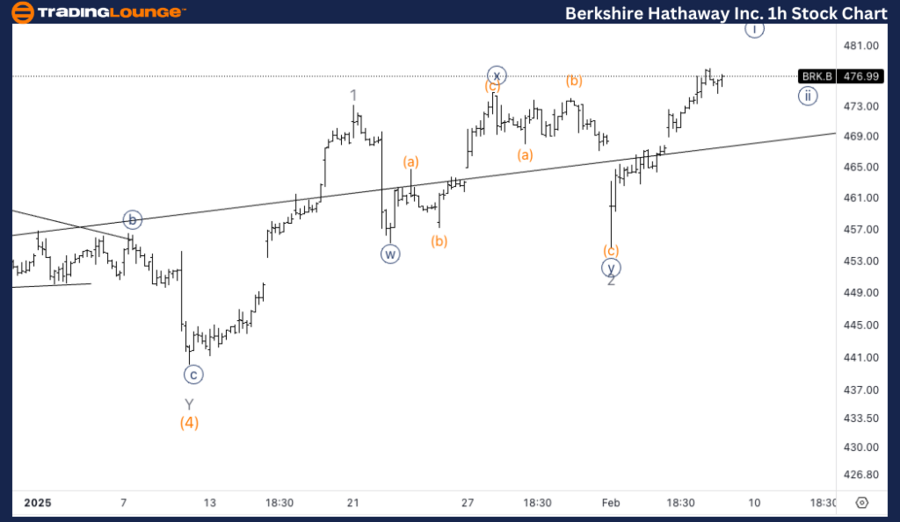
BRK.B Elliott Wave technical analysis
Function: Trend.
Mode: Impulsive.
Structure: Motive.
Position: Wave {i} of 3.
Direction: Top in wave {i}.
Details: We seem to be close to a wave {i} top to then pullback lower which could open up the possibility of a buy opportunity.
BRK.B Elliott Wave technical analysis – One-hour chart
On the 1-hour chart, BRK.B appears to be nearing a potential top in wave {i} of 3. After this wave {i} tops out, a corrective pullback is expected, potentially providing a buy opportunity for further upside in the next wave sequence. Traders should monitor key support levels during the pullback for signs of continuation into wave {iii}.
This analysis of Berkshire Hathaway Inc. (BRK.B) focuses on both the daily and 1-hour charts, using the Elliott Wave Theory to assess current market trends and forecast future price movements.
Berkshire Hathaway Inc. (BRK.B) Elliott Wave technical analysis [Video]
Author

Peter Mathers
TradingLounge
Peter Mathers started actively trading in 1982. He began his career at Hoei and Shoin, a Japanese futures trading company.


