|

Bank of America (BAC) shows bearish Elliott Wave sequence [Video]

Bank of America (BAC) shows a lower low bearish sequence from 1.10.2022 high favoring further downside in the stock. Near term, cycle from 2.8.2023 high is in progress as a 5 waves Elliott Wave impulse. Down from 2.8.2023 high, wave 1 ended at 33 and rally in wave 2 ended at 34.56 as the 1 hour chart below shows. The stock resumes lower in wave 3 with internal subdivision as another 5 waves impulse in lesser degree. Down from wave 2, wave ((i)) ended at 32.8 and rally in wave ((ii)) ended at 33.15. Stock resumes lower in wave ((iii)) towards 30.08 and wave ((iv)) ended at 30.81. Final leg lower wave ((v)) ended at 28.92 which completed wave 3 in higher degree.

Bank of America (BAC) 60 minutes Elliott Wave chart

BAC

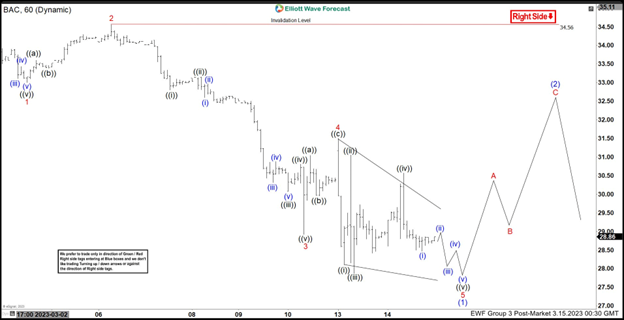
Wave 4 rally ended at 31.50 with internal subdivision as a zigzag. Up from wave 3, wave ((a)) ended at 31.04 and wave ((b)) ended at 29.95. Third leg wave ((c)) ended at 31.50 which completed wave 4. Stock resumes lower in wave 5 with internal as a diagonal. Down from wave 4, wave ((i)) ended at 28.10 and wave ((ii)) ended at 31.05. Wave ((iii)) ended at 27.87 and wave ((iv)) rally ended at 30.57. Expect the stock to end wave ((v)) of 5 soon and this should complete cycle from 2.8.2023 as wave (1). Afterwards, stock should rally in wave (2) to correct cycle from 2.8.2023 high before the decline resumes. As far as pivot at 34.56 stays intact, expect rally to fail in 3, 7, or 11 swing for further downside.

BAC Elliott Wave video

Author

Elliott Wave Forecast Team

Elliott Wave Forecast Team

ElliottWave-Forecast.com

More from Elliott Wave Forecast Team
Share:

Markets move fast. We move first.

Orange Juice Newsletter brings you expert driven insights - not headlines. Every day on your inbox.

By subscribing you agree to our Terms and conditions.

Editor's Picks

EUR/USD extends slide below 1.1700

The EUR/USD pair nears its weekly low at around 1.1660 in the American session on Tuesday, retreating from the 1.1750 price zone tested earlier in the day. Cautiously optimistic markets support the US Dollar in the near term.

GBP/USD consolidates around 1.3500; looks to US macro data for fresh impetus

The GBP/USD pair oscillates in a narrow range, around the 1.3500 psychological mark during the Asian session on Wednesday, and for now, seems to have stalled the previous day's retracement slide from its highest level since September 18. Moreover, the fundamental backdrop seems tilted in favor of bullish traders and suggests that the path of least resistance for spot prices is to the upside.

Gold extends upside to near $4,500 on Venezuela turmoil

Gold price climbs to near $4,500 during the early Asian trading hours on Wednesday. The precious metal rises by more than 1% in the day as geopolitical tensions and expectations of US rate cuts keep demand for gold high. The US ISM Services Purchasing Managers Index report will be published on Wednesday. 

Pump.fun prepares for early-year rally as DEX volume skyrockets

Pump.fun (PUMP) is rising alongside crypto majors such as Bitcoin (BTC) and is trading above $0.002400 at the time of writing on Tuesday. The Decentralized Exchange (DEX) native token outlook builds on a bullish tone developed since December 30.

Implications of US intervention in Venezuela

Events in Venezuela are top of mind for market participants, and while developments are associated with an elevated degree of uncertainty, we are not making any changes to our markets or economic forecasts as a result of the deposition of Nicolás Maduro. 

Cardano holds steady as bulls intensify push for breakout

Cardano rises above the 50-day EMA resistance amid a risk-on mood across the crypto market. The MACD upholds positive divergence, increasing the potential for a 20% breakout to $0.505.