Australian Dollar depreciates as Trump sets tariffs on China, ISM Manufacturing PMI eyed
- The Australian Dollar declined as US President Donald Trump set tariffs against China, Canada, and Mexico.
- China's Caixin Manufacturing Purchasing Managers' Index fell to 50.1 in January, down from 50.5 in December.
- The US plans to impose a 25% tariff on Canadian and Mexican goods, while China will face a 10% tariff.

The Australian Dollar (AUD) extends its losing streak against the US Dollar (USD) for the sixth consecutive session on Monday. The AUD/USD pair dropped around 2% amid risk-off sentiment following US President Donald Trump’s decision to impose import tariffs on China, one of Australia’s key trading partners.
On Saturday, the US announced plans to implement 25% tariffs on Canadian and Mexican goods, while Chinese exports would face a 10% tariff, according to Bloomberg. These tariffs, set to take effect on Tuesday, will remain in place until the fentanyl overdose crisis is "resolved."
In response, Canada, Mexico, and China have vowed to retaliate against the broad trade restrictions. China’s foreign ministry warned that the tariffs would inevitably impact future cooperation on drug control.
Meanwhile, Australia’s Retail Sales declined by 0.1% month-on-month in December 2024, marking the first drop in nine months. Although the decline was less severe than the anticipated 0.7% contraction, it highlights weakening consumer spending, increasing speculation that the Reserve Bank of Australia (RBA) may consider a rate cut in February.
China's Caixin Manufacturing Purchasing Managers' Index (PMI) declined to 50.1 in January, down from 50.5 in December. The reading fell short of market expectations, which had anticipated a steady 50.5.
Australian Dollar loses ground as Trump initiates trade war
- The US Dollar Index (DXY), which measures the US Dollar’s value against six major currencies, rises for the fifth successive day and trades above 109.50 at the time of writing. ISM Manufacturing PMI for January will be eyed later on Monday.
- The US Personal Consumption Expenditures (PCE) Price Index, the Fed’s preferred inflation gauge, rose 0.3% MoM in December, up from 0.1% in November. On an annual basis, PCE inflation accelerated to 2.6% from the previous 2.4%, while core PCE, which excludes food and energy, remained steady at 2.8% YoY for the third straight month.
- The Department of Commerce reported that Gross Domestic Product Annualized (Q4) fell to 2.3% from 3.1%, missing expectations of 2.6%. Additionally, Initial Jobless Claims for the week ending January 24 came in at 207K, below forecasts of 220K but an improvement from the previous week’s 223K.
- Fed Chair Jerome Powell emphasized during the post-meeting press conference that the central bank would need to see “real progress on inflation or some weakness in the labor market” before considering any further adjustments to monetary policy.
- US Treasury Secretary Scott Bessent warned Key Square Capital Management partners a year ago that “tariffs are inflationary and would strengthen the US Dollar—hardly a good starting point for a US industrial renaissance.” However, according to the Financial Times (FT), Bessent last week advocated for new universal tariffs on US imports, proposing an initial 2.5% rate that would gradually increase.
- President Trump announced his threat on X (formerly Twitter) to levy 100% tariffs on BRICS nations if they attempt to introduce an alternative currency to challenge the US dollar in international trade.
- Australia’s Retail Sales increased by 4.6% year-over-year compared to December 2023. On a seasonally adjusted basis, sales rose 1.0% QoQ in the December quarter of 2024.
- ANZ, CBA, Westpac, and now National Australia Bank (NAB) all anticipate a 25 basis point (bps) rate cut from the Reserve Bank of Australia (RBA) in February. Previously, the NAB had forecasted a rate cut in May but has now moved its projection forward to the February RBA meeting.
- The Reserve Bank of Australia released its January 2025 Bulletin, featuring a detailed analysis of how monetary policy changes influence interest rates in the economy and how fluctuations in interest rates impact economic activity and inflation.
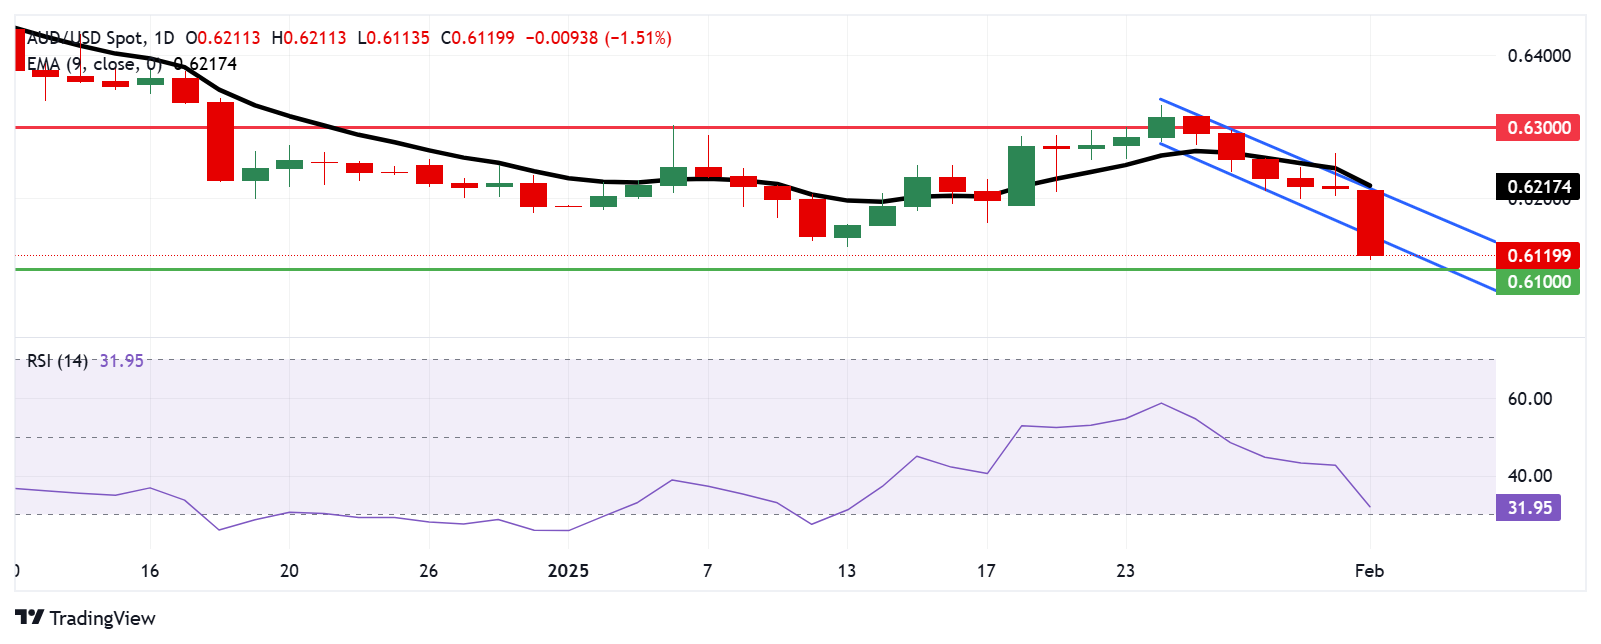
Australian Dollar breaks below descending channel’s lower boundary
AUD/USD hovers around 0.6130 on Monday, trading below the descending channel pattern on the daily chart, signaling a strengthening bearish bias. The 14-day Relative Strength Index (RSI) has dropped near the 30 mark, reinforcing the ongoing downside momentum.
On the downside, the AUD/USD pair could test the psychological support level of 0.6131, last seen in April 2020.
Alternatively, if the pair attempts a rebound, it may re-enter the descending channel and target the upper boundary, which aligns with the nine-day Exponential Moving Average (EMA) at 0.6217.
AUD/USD: Daily Chart
Australian Dollar PRICE Today
The table below shows the percentage change of Australian Dollar (AUD) against listed major currencies today. Australian Dollar was the weakest against the US Dollar.
| USD | EUR | GBP | JPY | CAD | AUD | NZD | CHF | |
|---|---|---|---|---|---|---|---|---|
| USD | 1.11% | 0.84% | 0.23% | 0.06% | 1.22% | 0.74% | -0.04% | |
| EUR | -1.11% | 0.13% | 0.45% | 0.26% | 0.57% | 0.93% | 0.19% | |
| GBP | -0.84% | -0.13% | -0.80% | 0.12% | 0.44% | 0.80% | 0.04% | |
| JPY | -0.23% | -0.45% | 0.80% | -0.16% | 1.15% | 1.43% | 0.38% | |
| CAD | -0.06% | -0.26% | -0.12% | 0.16% | 0.06% | 0.68% | -0.09% | |
| AUD | -1.22% | -0.57% | -0.44% | -1.15% | -0.06% | 0.36% | -0.40% | |
| NZD | -0.74% | -0.93% | -0.80% | -1.43% | -0.68% | -0.36% | -0.76% | |
| CHF | 0.04% | -0.19% | -0.04% | -0.38% | 0.09% | 0.40% | 0.76% |
The heat map shows percentage changes of major currencies against each other. The base currency is picked from the left column, while the quote currency is picked from the top row. For example, if you pick the Australian Dollar from the left column and move along the horizontal line to the US Dollar, the percentage change displayed in the box will represent AUD (base)/USD (quote).
Economic Indicator
ISM Manufacturing PMI
The Institute for Supply Management (ISM) Manufacturing Purchasing Managers Index (PMI), released on a monthly basis, is a leading indicator gauging business activity in the US manufacturing sector. The indicator is obtained from a survey of manufacturing supply executives based on information they have collected within their respective organizations. Survey responses reflect the change, if any, in the current month compared to the previous month. A reading above 50 indicates that the manufacturing economy is generally expanding, a bullish sign for the US Dollar (USD). A reading below 50 signals that factory activity is generally declining, which is seen as bearish for USD.
Read more.Next release: Mon Feb 03, 2025 15:00
Frequency: Monthly
Consensus: 49.5
Previous: 49.3
Source: Institute for Supply Management
The Institute for Supply Management’s (ISM) Manufacturing Purchasing Managers Index (PMI) provides a reliable outlook on the state of the US manufacturing sector. A reading above 50 suggests that the business activity expanded during the survey period and vice versa. PMIs are considered to be leading indicators and could signal a shift in the economic cycle. Stronger-than-expected prints usually have a positive impact on the USD. In addition to the headline PMI, the Employment Index and the Prices Paid Index numbers are watched closely as they shine a light on the labour market and inflation.
Author

Akhtar Faruqui
FXStreet
Akhtar Faruqui is a Forex Analyst based in New Delhi, India. With a keen eye for market trends and a passion for dissecting complex financial dynamics, he is dedicated to delivering accurate and insightful Forex news and analysis.


