Australian Dollar declines due to softer Index of Commodity Prices
- The Australian Dollar loses ground as the RBA Index of Commodity Prices fell by 4.1% YoY in June.
- RBA Minutes emphasizes the need to remain vigilant as data suggested an upside risk for May's CPI.
- The US Dollar appreciates due to the higher US Treasury yields amid heightened expectations of the Fed reducing rates in 2024.

The Australian Dollar (AUD) extends its losses for the second successive day on Tuesday. This downturn could be attributed to the Reserve Bank of Australia's (RBA) Index of Commodity Prices, which fell by 4.1% year-on-year in June, following an upwardly revised 6.0% decline in the previous month. The June decline marks the mildest deflation in sixteen consecutive months.
The Minutes of the Reserve Bank of Australia’s (RBA) June monetary policy meeting, released Tuesday, indicated that the "board judged the case for holding rates steady stronger than hiking." The board emphasized the need to remain vigilant to upside risks to inflation, noting that data suggested an upside risk for May's Consumer Price Index (CPI).
The US Dollar (USD) appreciates due to the advance in the US Treasury yields. The Greenback may limit its upside due to the heightened expectations of the US Federal Reserve’s (Fed) deducting interest rates in 2024. The speech by Federal Reserve (Fed) Chairman Jerome Powell will be in the spotlight on Tuesday.
Daily Digest Market Movers: Australian Dollar declines due to softer Index of Commodity Prices
- The Melbourne Institute's Monthly Inflation Gauge has heightened concerns that the RBA might raise interest rates again in August. The gauge increased by 0.3% in June, maintaining the same pace as in May, marking the fourth consecutive month of rises and remaining at the highest since January.
- Chinese state media outlet Securities Daily quotes the chief economist at CITIC Securities, suggesting that the People's Bank of China (PBOC) might consider measures like reducing the reserve requirement ratio (RRR) to inject liquidity into the market. Any potential economic shift in China could notably influence the Australian Dollar (AUD), given the close trade ties between the two nations.
- The Judo Bank Australia Manufacturing PMI dropped for the fifth consecutive month to 47.2 in June from 49.7 in May. This decline is the fastest deterioration since May 2020.
- The US Manufacturing Purchasing Managers Index (PMI) for June fell to 48.5, down from 48.7 in May. This figure was weaker than the expected 49.1, as reported on Monday.
- On Friday, the Federal Reserve Bank of San Francisco President Mary Daly said that monetary policy is working. Still, it’s too early to tell when it will be appropriate to cut the interest rate. Daly stated, "If inflation stays sticky or comes down slowly, rates would need to be higher for longer,” per Reuters.
- The Reserve Bank of Australia’s (RBA) Deputy Governor Andrew Hauser. Hauser said it would be a “bad mistake” to formulate policy in response to a single inflation report. He emphasized that there is still a suite of economic data to come that will require detailed analysis, per Bloomberg.
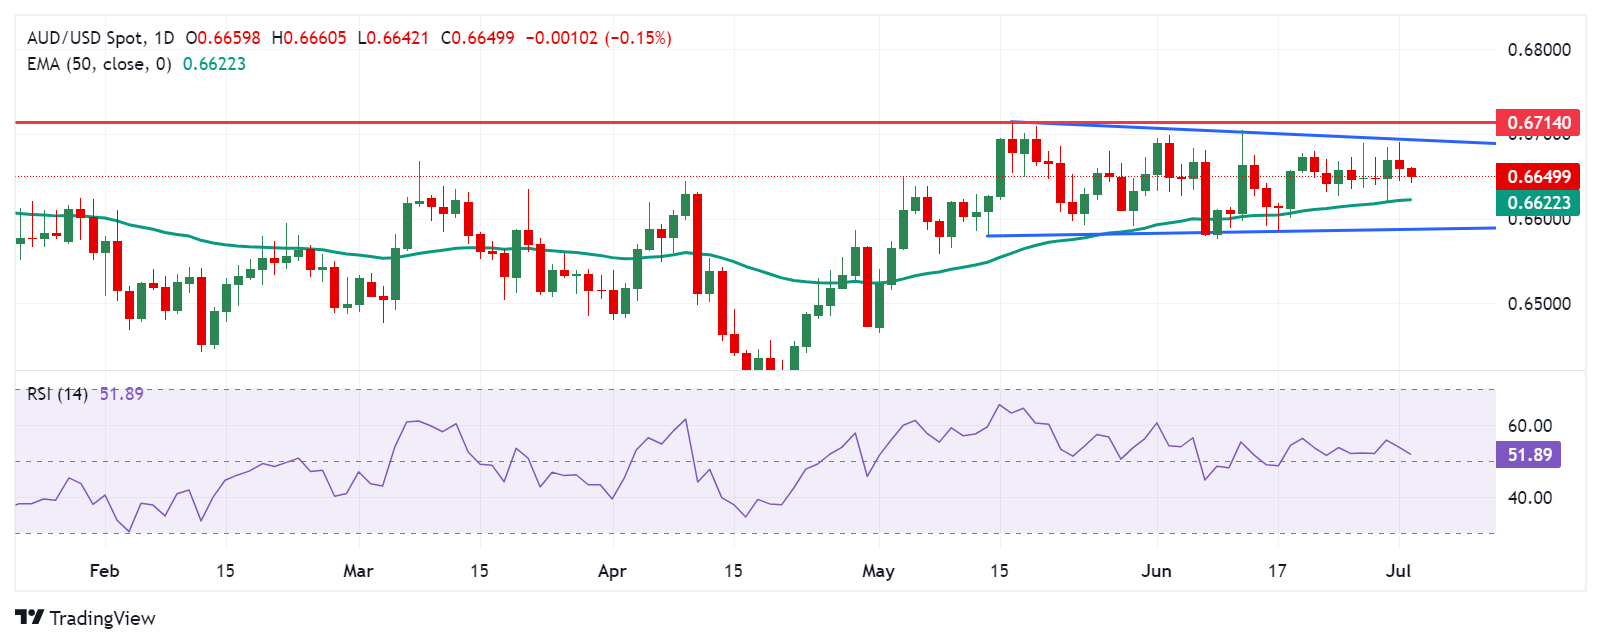
Technical Analysis: Australian Dollar hovers around 0.6650
The Australian Dollar trades around 0.6640 on Tuesday. The analysis of the daily chart shows a neutral bias for the AUD/USD pair, which is consolidating within a rectangle formation. The 14-day Relative Strength Index (RSI) is at 50, also indicating neutral momentum. Future movements may provide a clearer directional trend.
The AUD/USD pair may face resistance near the upper boundary of the rectangle formation at around 0.6690, followed by the psychological level of 0.6700. Additional resistance is located at 0.6714, the highest level since January.
On the downside, the AUD/USD pair could find support near the 50-day Exponential Moving Average (EMA) at 0.6622. A break below this level could lead the pair to test the lower boundary of the rectangle formation near 0.6585.
AUD/USD: Daily Chart
(This story was corrected on July 3 at 08:50 GMT to say, in the third paragraph, that the Greenback may limit its upside...)
Australian Dollar PRICE Today
The table below shows the percentage change of Australian Dollar (AUD) against listed major currencies today. Australian Dollar was the weakest against the US Dollar.
| USD | EUR | GBP | JPY | CAD | AUD | NZD | CHF | |
|---|---|---|---|---|---|---|---|---|
| USD | 0.06% | 0.08% | 0.13% | 0.06% | 0.25% | 0.36% | 0.18% | |
| EUR | -0.06% | 0.03% | 0.09% | -0.01% | 0.19% | 0.27% | 0.10% | |
| GBP | -0.08% | -0.03% | 0.06% | -0.01% | 0.15% | 0.25% | 0.06% | |
| JPY | -0.13% | -0.09% | -0.06% | -0.08% | 0.13% | 0.20% | 0.00% | |
| CAD | -0.06% | 0.00% | 0.01% | 0.08% | 0.19% | 0.30% | 0.09% | |
| AUD | -0.25% | -0.19% | -0.15% | -0.13% | -0.19% | 0.10% | -0.12% | |
| NZD | -0.36% | -0.27% | -0.25% | -0.20% | -0.30% | -0.10% | -0.21% | |
| CHF | -0.18% | -0.10% | -0.06% | -0.01% | -0.09% | 0.12% | 0.21% |
The heat map shows percentage changes of major currencies against each other. The base currency is picked from the left column, while the quote currency is picked from the top row. For example, if you pick the Australian Dollar from the left column and move along the horizontal line to the US Dollar, the percentage change displayed in the box will represent AUD (base)/USD (quote).
Economic Indicator
AiG Industry Index
The AiG Industry Index, released on a monthly basis by the Australian Industry Group, is a leading indicator gauging private-business activity in Australia. This indicator integrates the different sub-indexes calculated by the AiG, including the manufacturing, construction, and services sectors – industries that together account for 36% of the Australian economy. The Australian Industry Index is based on monthly surveys from a national sample of Australian businesses. A positive reading indicates that activity is expanding; negative indicates contraction. The distance from zero indicates the strength of the expansion or decline. A positive reading tends to be a bullish sign for the Australian Dollar (AUD). Meanwhile, a negative reading is seen as bearish for AUD.
Read more.Next release: Tue Jul 02, 2024 23:00
Frequency: Monthly
Consensus: -
Previous: -40.3
Source: Australian Industry Group
Author

Akhtar Faruqui
FXStreet
Akhtar Faruqui is a Forex Analyst based in New Delhi, India. With a keen eye for market trends and a passion for dissecting complex financial dynamics, he is dedicated to delivering accurate and insightful Forex news and analysis.


