Australian Dollar struggles due to a potential 25 bps rate cut by RBA in May
- The Australian Dollar could advance as the US Dollar struggles since the Fed’s Beige Book suggested weakening economic conditions.
- Westpac anticipates that the RBA will cut interest rates by 25 basis points at its May 20 meeting.
- The US Dollar declined following the release of the mixed S&P Global Purchasing Managers Index on Wednesday.

The Australian Dollar (AUD) remains steady on Thursday following two consecutive days of losses. The AUD/USD pair could see gains as the US Dollar (USD) faces pressure after the Federal Reserve's (Fed) Beige Book suggested weakening economic conditions.
According to the Fed’s April Beige Book, concerns over tariffs have worsened the economic outlook across several regions in the United States (US). Consumer spending presented a mixed picture, while the labor market showed signs of softening, with many districts reporting flat or slightly declining employment levels.
Westpac anticipates that the Reserve Bank of Australia (RBA) will cut interest rates by 25 basis points at its May 20 meeting. In recent quarters, the RBA's policy decisions have been heavily data-dependent, making it challenging to project the Board’s actions beyond the upcoming meeting with certainty.
US President Donald Trump stated that it's up to China how soon tariffs can be reduced. Trump mentioned that the US will determine the tariff rates for China over the next two to three weeks. "If we don't reach a deal, we're simply setting the price — then it's up to them to decide if they want to proceed," he said. He also noted that China currently isn’t doing any business with the US, adding that the tariff rate remains at 145%. However, National Economic Council Director Hassett said on Wednesday that a full China-US trade deal could take 2-3 years.
The preliminary data from Australia’s Judo Bank on Wednesday showed that private sector activity grew for the seventh straight month in April, supported by continued expansion in both manufacturing and services.
Australian Dollar remains muted as US Dollar struggles following mixed PMI data
- The US Dollar Index (DXY), which measures the USD against six major currencies, edges lower after registering gains in the previous two successive sessions, trading near 99.60 at the time of writing. The Greenback faced headwinds following the release of the mixed S&P Global Purchasing Managers Index (PMI) on Wednesday.
- The flash S&P Global Composite PMI for April dropped to 51.2 from 53.5, indicating a slowdown in overall business activity. Although the Manufacturing PMI inched up to 50.7, the Services PMI declined sharply to 51.4 from 54.4, pointing to softening demand in the services sector.
- S&P Global’s Chris Williamson commented that growth momentum is losing steam, while persistent inflationary pressures continue to complicate the Federal Reserve’s efforts to strike a balance.
- US Treasury Secretary Scott Bessent acknowledged on Wednesday that current tariffs—145% on Chinese goods and 125% on US goods—are unsustainable and must be lowered for meaningful dialogue to begin.
- National Economic Council Director Kevin Hassett, President Trump's chief economic adviser, stated that the US Trade Representative (USTR) has 14 meetings scheduled with foreign trade ministers. Hassett also noted that 18 written proposals have been received from these ministers. According to Hassett, China remains open to negotiations.
- Market sentiment was boosted by US President Donald Trump, who reassured investors that he has no intention of removing Federal Reserve (Fed) Chair Jerome Powell, helping ease concerns about central bank independence and policy direction.
- The White House announced on Tuesday that the Trump administration is making headway in negotiating trade deals aimed at easing the broad tariffs introduced earlier this month. According to US Press Secretary Karoline Leavitt, 18 countries have already submitted trade proposals to the US, and President Trump’s trade team is scheduled to meet with representatives from 34 nations this week to explore potential agreements.
- The Judo Bank Manufacturing PMI edged down to a two-month low of 51.7 in April, compared to 52.1 in March. While manufacturing output remained in expansion territory, the increase in new orders was modest. Meanwhile, the Services PMI dipped slightly to 51.4 from 51.6 in the previous month, and the Composite PMI also eased to 51.4 from 51.6.
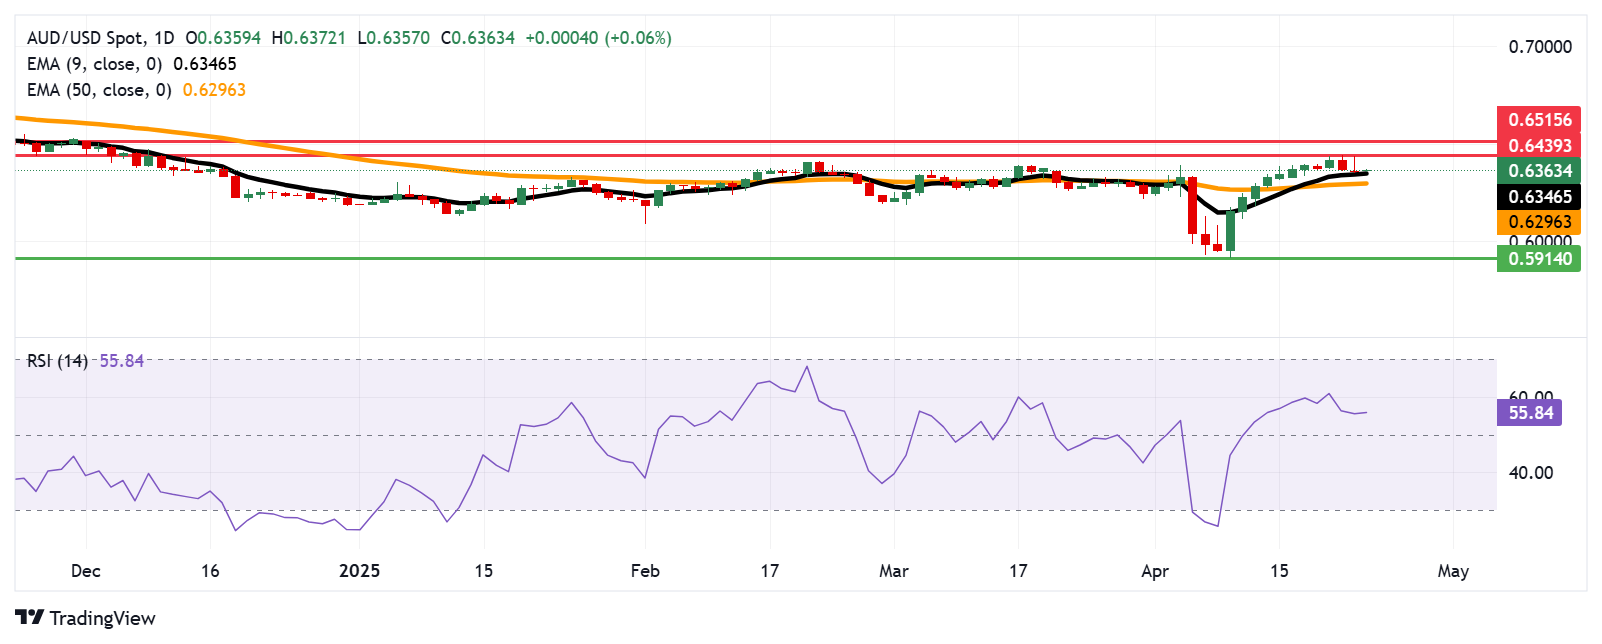
Australian Dollar tests 0.6350 support near nine-day EMA
The AUD/USD pair is trading near 0.6360 on Thursday, with technical indicators on the daily chart reflecting a bullish tone. The pair continues to hold above the nine-day Exponential Moving Average (EMA), while the 14-day Relative Strength Index (RSI) remains steady above 50, suggesting sustained upward momentum.
On the upside, immediate resistance is seen at the recent four-month high of 0.6439, marked on April 22. A decisive break above this level could pave the way for a rally toward the five-month high of 0.6515.
The AUD/USD pair is testing immediate support at the nine-day EMA of 0.6346, with stronger support near the 50-day EMA at 0.6296. A sustained drop below these levels would undermine the bullish setup and could lead to deeper losses, potentially exposing the March 2025 low around 0.5914.
AUD/USD: Daily Chart
Australian Dollar PRICE Today
The table below shows the percentage change of Australian Dollar (AUD) against listed major currencies today. Australian Dollar was the weakest against the Japanese Yen.
| USD | EUR | GBP | JPY | CAD | AUD | NZD | CHF | |
|---|---|---|---|---|---|---|---|---|
| USD | -0.18% | -0.11% | -0.40% | -0.09% | 0.02% | -0.10% | -0.24% | |
| EUR | 0.18% | 0.07% | -0.23% | 0.09% | 0.18% | 0.08% | -0.05% | |
| GBP | 0.11% | -0.07% | -0.28% | 0.02% | 0.12% | 0.01% | -0.12% | |
| JPY | 0.40% | 0.23% | 0.28% | 0.30% | 0.42% | 0.27% | 0.22% | |
| CAD | 0.09% | -0.09% | -0.02% | -0.30% | 0.14% | 0.00% | -0.14% | |
| AUD | -0.02% | -0.18% | -0.12% | -0.42% | -0.14% | -0.11% | -0.25% | |
| NZD | 0.10% | -0.08% | -0.01% | -0.27% | -0.01% | 0.11% | -0.11% | |
| CHF | 0.24% | 0.05% | 0.12% | -0.22% | 0.14% | 0.25% | 0.11% |
The heat map shows percentage changes of major currencies against each other. The base currency is picked from the left column, while the quote currency is picked from the top row. For example, if you pick the Australian Dollar from the left column and move along the horizontal line to the US Dollar, the percentage change displayed in the box will represent AUD (base)/USD (quote).
Australian Dollar FAQs
One of the most significant factors for the Australian Dollar (AUD) is the level of interest rates set by the Reserve Bank of Australia (RBA). Because Australia is a resource-rich country another key driver is the price of its biggest export, Iron Ore. The health of the Chinese economy, its largest trading partner, is a factor, as well as inflation in Australia, its growth rate and Trade Balance. Market sentiment – whether investors are taking on more risky assets (risk-on) or seeking safe-havens (risk-off) – is also a factor, with risk-on positive for AUD.
The Reserve Bank of Australia (RBA) influences the Australian Dollar (AUD) by setting the level of interest rates that Australian banks can lend to each other. This influences the level of interest rates in the economy as a whole. The main goal of the RBA is to maintain a stable inflation rate of 2-3% by adjusting interest rates up or down. Relatively high interest rates compared to other major central banks support the AUD, and the opposite for relatively low. The RBA can also use quantitative easing and tightening to influence credit conditions, with the former AUD-negative and the latter AUD-positive.
China is Australia’s largest trading partner so the health of the Chinese economy is a major influence on the value of the Australian Dollar (AUD). When the Chinese economy is doing well it purchases more raw materials, goods and services from Australia, lifting demand for the AUD, and pushing up its value. The opposite is the case when the Chinese economy is not growing as fast as expected. Positive or negative surprises in Chinese growth data, therefore, often have a direct impact on the Australian Dollar and its pairs.
Iron Ore is Australia’s largest export, accounting for $118 billion a year according to data from 2021, with China as its primary destination. The price of Iron Ore, therefore, can be a driver of the Australian Dollar. Generally, if the price of Iron Ore rises, AUD also goes up, as aggregate demand for the currency increases. The opposite is the case if the price of Iron Ore falls. Higher Iron Ore prices also tend to result in a greater likelihood of a positive Trade Balance for Australia, which is also positive of the AUD.
The Trade Balance, which is the difference between what a country earns from its exports versus what it pays for its imports, is another factor that can influence the value of the Australian Dollar. If Australia produces highly sought after exports, then its currency will gain in value purely from the surplus demand created from foreign buyers seeking to purchase its exports versus what it spends to purchase imports. Therefore, a positive net Trade Balance strengthens the AUD, with the opposite effect if the Trade Balance is negative.
Author

Akhtar Faruqui
FXStreet
Akhtar Faruqui is a Forex Analyst based in New Delhi, India. With a keen eye for market trends and a passion for dissecting complex financial dynamics, he is dedicated to delivering accurate and insightful Forex news and analysis.


