|

AUDUSD Price Analysis: An inverted head-and-shoulders pattern can lift the AUD toward 0.6950s

  • The AUDUSD tests the 100-day EMA, propelled by an inverted head-and-shoulders chart pattern.
  • Once the head-and-shoulders pattern is achieved, the AUUSD could extend its gains toward the 200-day EMA.

The AUDUSD is rallying sharply in the North American session and challenges the 100-day Exponential Moving Average (EMA) at 0.6701. Fundamental factors, but also an inverted head-and-shoulders chart pattern in the AUDUSD daily chart, underpinned the Australian Dollar (AUD), which is gaining 1.24%. At the time of writing, the AUDUSD is trading at 0.6701 after hitting a daily low of 0.6577.

AUDUSD Price Analysis: Technical outlook

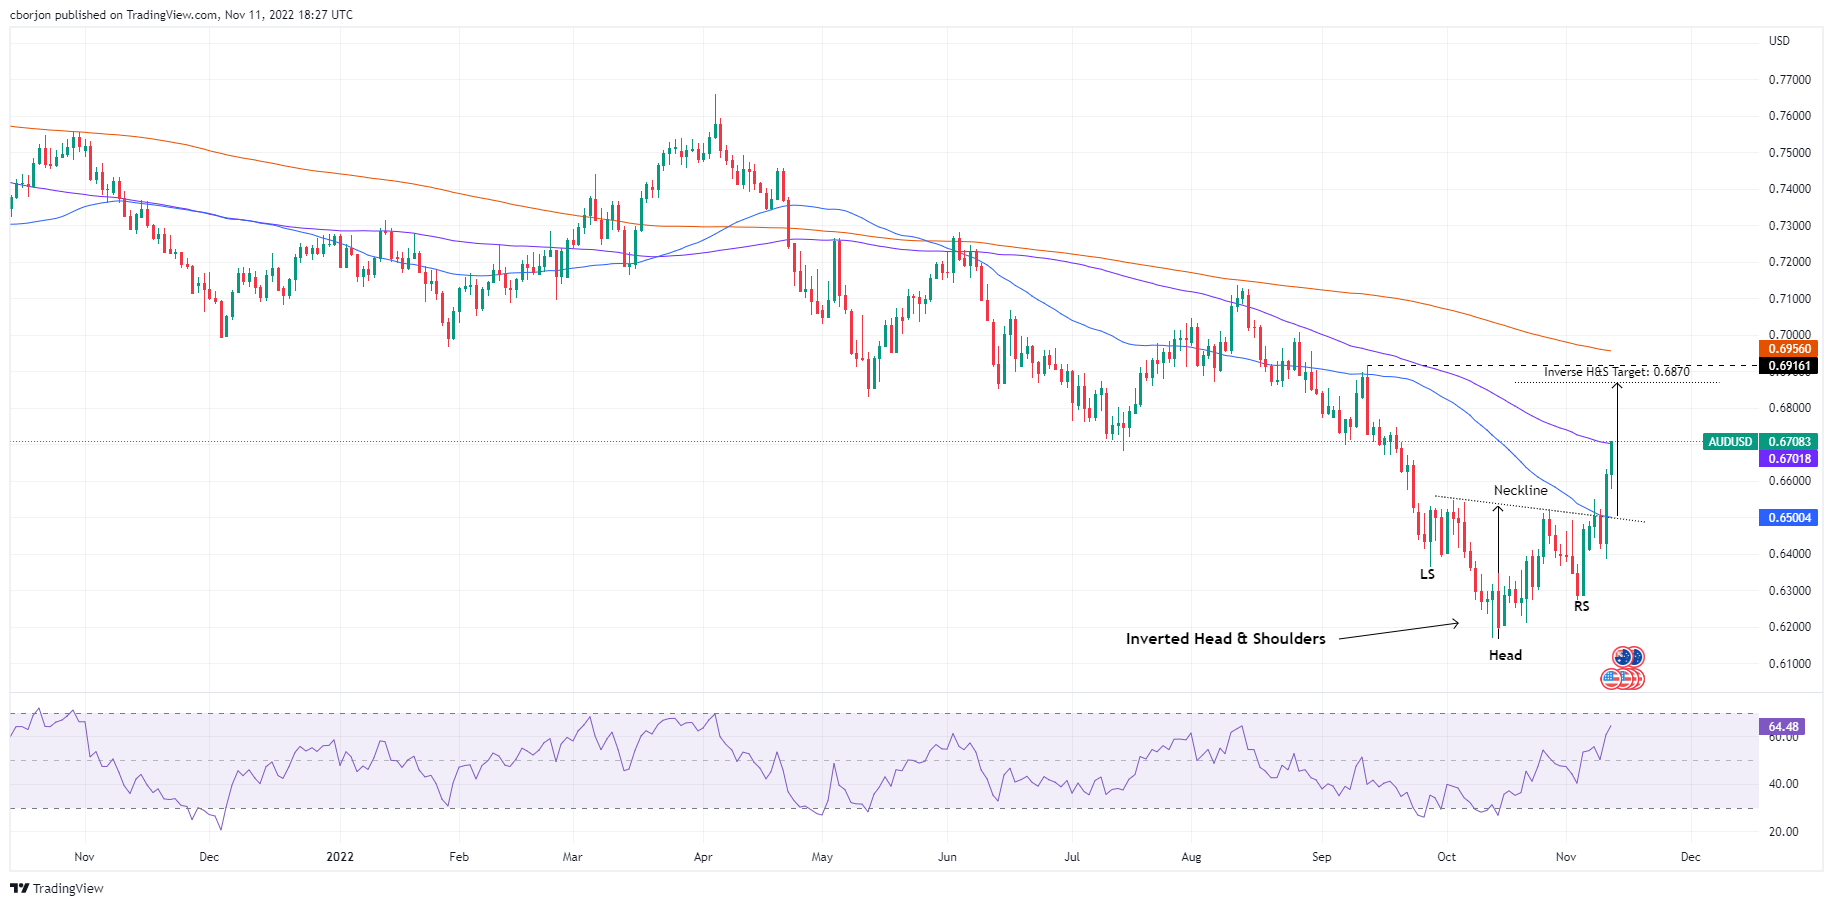
The AUDUSD daily chart depicts the AUD clearing the inverted head-and-shoulders neckline on Thursday, November 11. It should be noted that during that day, the AUDUSD registered a daily low of 0.6412. But a softer US Consumer Price Index (CPI) report lifted the AUDUSD, which rallied almost 190 pips.

At the time of typing, the AUDUSD probes the 100-day EMA, which, once cleared, could pave the way for further gains. Traders should be aware that the Relative Strength Index (RSI) is at bullish territory. So the path of least resistance in the AUDUSD is upward biased.

The AUDUSD's first resistance would be the 100-day EMA at 0.6701. The break above will expose the 0.6800 psychological mark, followed by the inverted head-and-shoulders target at 0.6870. However, a breach of the latter will pave the way toward key resistance areas like the September 13 swing high at 0.6916 and the 200-day EMA at 0.6956.

AUDUSD Key Technical Levels

AUD/USD

Overview
Today last price0.6701
Today Daily Change0.0085
Today Daily Change %1.28
Today daily open0.6616
 
Trends
Daily SMA200.6386
Daily SMA500.6504
Daily SMA1000.6706
Daily SMA2000.696
 
Levels
Previous Daily High0.662
Previous Daily Low0.6387
Previous Weekly High0.6493
Previous Weekly Low0.6272
Previous Monthly High0.6548
Previous Monthly Low0.617
Daily Fibonacci 38.2%0.6531
Daily Fibonacci 61.8%0.6476
Daily Pivot Point S10.6462
Daily Pivot Point S20.6307
Daily Pivot Point S30.6228
Daily Pivot Point R10.6696
Daily Pivot Point R20.6775
Daily Pivot Point R30.6929

Author

Christian Borjon Valencia

Christian Borjon began his career as a retail trader in 2010, mainly focused on technical analysis and strategies around it. He started as a swing trader, as he used to work in another industry unrelated to the financial markets.

More from Christian Borjon Valencia
Share:

Markets move fast. We move first.

Orange Juice Newsletter brings you expert driven insights - not headlines. Every day on your inbox.

By subscribing you agree to our Terms and conditions.

Editor's Picks

EUR/USD moves sideways below 1.1800 on Christmas Eve

EUR/USD struggles to find direction and trades in a narrow channel below 1.1800 after posting gains for two consecutive days. Bond and stock markets in the US will open at the usual time and close early on Christmas Eve, allowing the trading action to remain subdued. 

GBP/USD keeps range around 1.3500 amid quiet markets

GBP/USD keeps its range trade intact at around 1.3500 on Wednesday. The Pound Sterling holds the upper hand over the US Dollar amid pre-Christmas light trading as traders move to the sidelines heading into the holiday season. 

Gold retreats from record highs, trades below $4,500

Gold retreats after setting a new record-high above $4,520 earlier in the day and trades in a tight range below $4,500 as trading volumes thin out ahead of the Christmas break. The US Dollar selling bias remains unabated on the back of dovish Fed expectations, which continues to act as a tailwind for the bullion amid persistent geopolitical risks.

Bitcoin slips below $87,000 as ETF outflows intensify, whale participation declines

Bitcoin price continues to trade around $86,770 on Wednesday, after failing to break above the $90,000 resistance. US-listed spot ETFs record an outflow of $188.64 million on Tuesday, marking the fourth consecutive day of withdrawals.

Economic outlook 2026-2027 in advanced countries: Solidity test

After a year marked by global economic resilience and ending on a note of optimism, 2026 looks promising and could be a year of solid economic performance. In our baseline scenario, we expect most of the supportive factors at work in 2025 to continue to play a role in 2026.

Avalanche struggles near $12 as Grayscale files updated form for ETF

Avalanche trades close to $12 by press time on Wednesday, extending the nearly 2% drop from the previous day. Grayscale filed an updated form to convert its Avalanche-focused Trust into an ETF with the US Securities and Exchange Commission.