|

AUD/USD Technical Analysis: Aussie sidelined near November lows

  • The aussie is trapped in a tight trading range this week.
  • The level to beat for bears is the 0.6773 swing low.
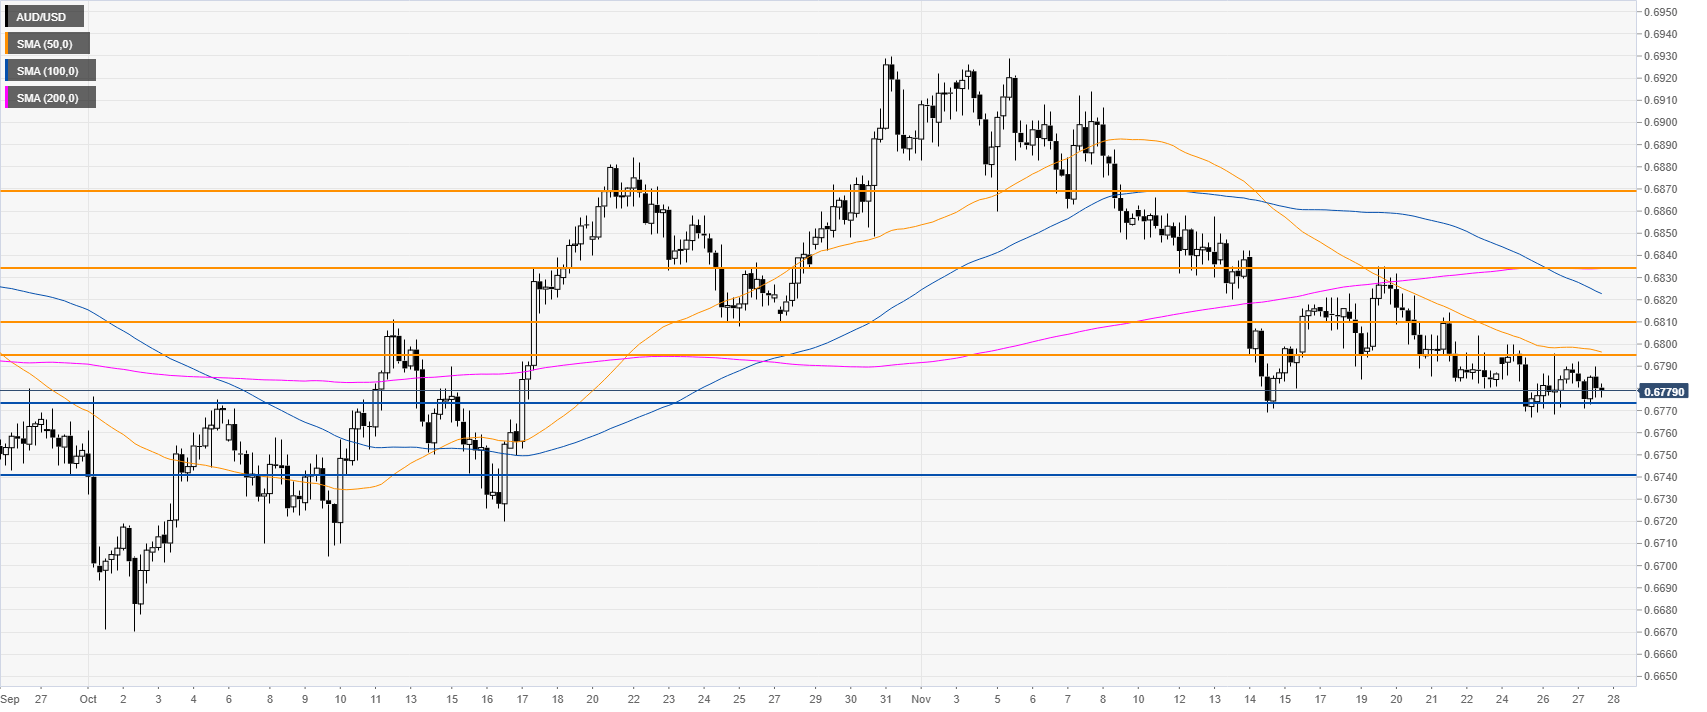
 

AUD/USD daily chart 

 
The aussie is trading in a bear trend below its main daily simple moving averages (DMAs) on the daily chart. The market is trapped in a range, currently holding above the November lows. 
 

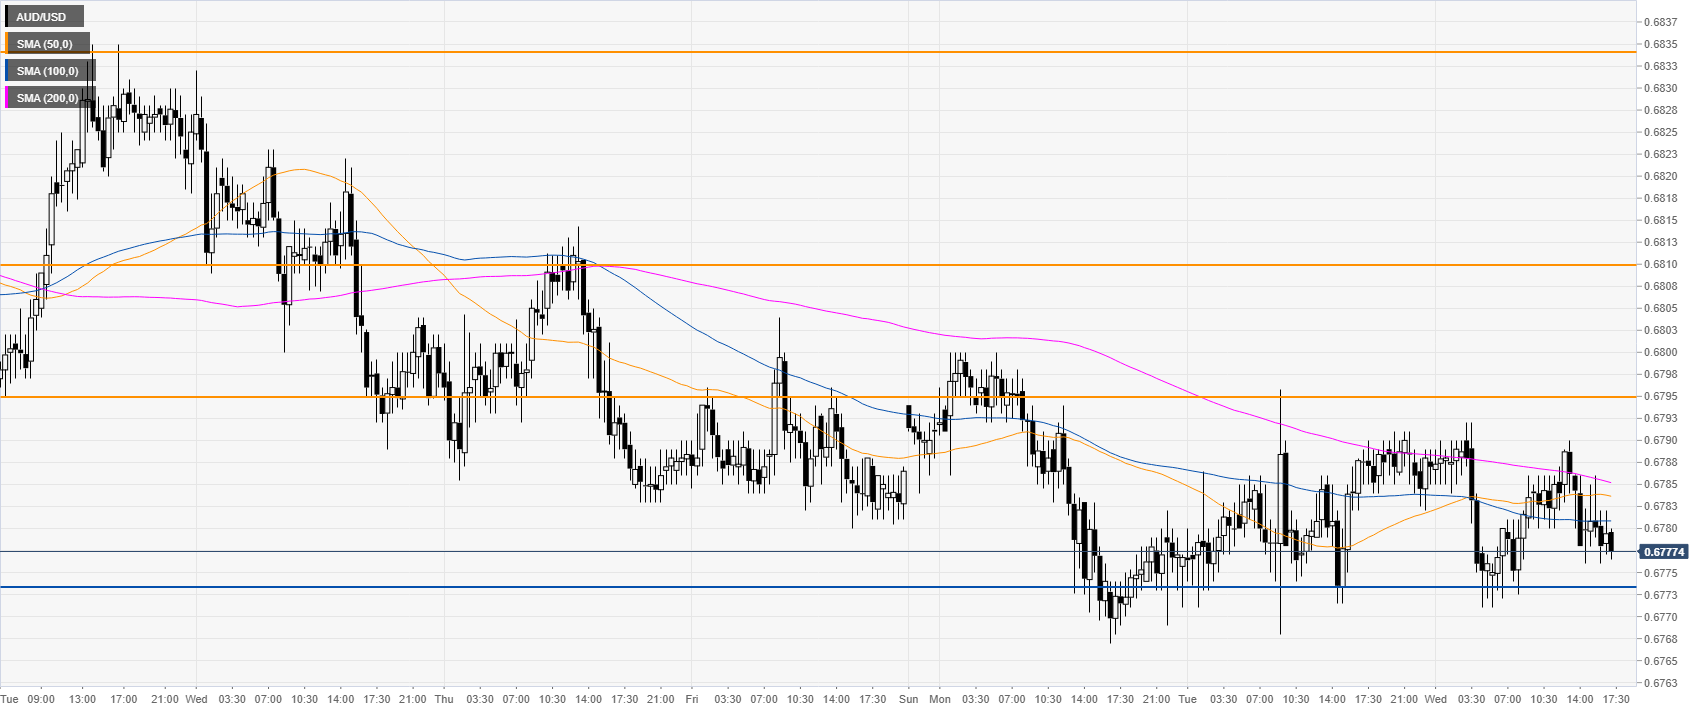
AUD/USD four-hour chart

 
The spot is sidelined just above the November lows. If AUD/USD breaks below the 0.6773 (swing low), the bears could send the market down to the 0.6740 level, according to the Technical Confluences Indicator


AUD/USD 30-minute chart 

 
AUD/USD is under pressure below the 0.6795 resistance and the main SMAs, suggesting a bearish bias in the short term. Resistance is expected at 0.6795 and the 0.6810 price levels, according to the Technical Confluences Indicator. 
 

Additional key levels

AUD/USD

Overview
Today last price0.6779
Today Daily Change-0.0010
Today Daily Change %-0.15
Today daily open0.6789
 
Trends
Daily SMA200.6842
Daily SMA500.6807
Daily SMA1000.6828
Daily SMA2000.6928
 
Levels
Previous Daily High0.6796
Previous Daily Low0.6768
Previous Weekly High0.6835
Previous Weekly Low0.678
Previous Monthly High0.693
Previous Monthly Low0.667
Daily Fibonacci 38.2%0.6785
Daily Fibonacci 61.8%0.6779
Daily Pivot Point S10.6773
Daily Pivot Point S20.6756
Daily Pivot Point S30.6745
Daily Pivot Point R10.68
Daily Pivot Point R20.6812
Daily Pivot Point R30.6828

Author

Flavio Tosti

Flavio Tosti

Independent Analyst


More from Flavio Tosti
Share:

Editor's Picks

EUR/USD treads water above 1.1850 amid thin trading

EUR/USD stays defensive but holds 1.1850 amid quiet markets in the European hours on Monday.  The US Dollar is struggling for direction due to thin liquidity conditions as US markets are closed in observance of Presidents' Day. 

GBP/USD flat lines as traders await key UK and US macro data

GBP/USD kicks off a new week on a subdued note and oscillates in a narrow range near 1.365 in Monday's European trading. The mixed fundamental backdrop warrants some caution for aggressive traders as the market focus now shifts to this week's important releases from the UK and the US.

Gold sticks to intraday losses; lacks follow-through

Gold remains depressed through the early European session on Monday, though it has managed to rebound from the daily trough and currently trades around the $5,000 psychological mark. Moreover, a combination of supporting factors warrants some caution for aggressive bearish traders, and before positioning for deeper losses.

Bitcoin consolidates as on-chain data show mixed signals

Bitcoin price has consolidated between $65,700 and $72,000 over the past nine days, with no clear directional bias. US-listed spot ETFs recorded a $359.91 million weekly outflow, marking the fourth consecutive week of withdrawals.

The week ahead: Key inflation readings and why the AI trade could be overdone

It is likely to be a quiet start to the week, with US markets closed on Monday for Presidents Day. European markets are higher across the board and gold is clinging to the $5,000 level after the tamer than expected CPI report in the US reduced haven flows to precious metals.

Monero Price Forecast: XMR risks a drop below $300 under mounting bearish pressure

Monero (XMR) starts the week under pressure, recording a 4% decline at press time on Monday after a 7% drop the previous day, putting the $300 support zone in focus.