|

AUD/USD Technical Analysis: Aussie sidelined near 0.6810 ahead of FOMC minutes

  • The Aussie is trading sideways in the New York session ahead of the FOMC minutes.
  • The level to beat for bears is the 0.6809 support level. 
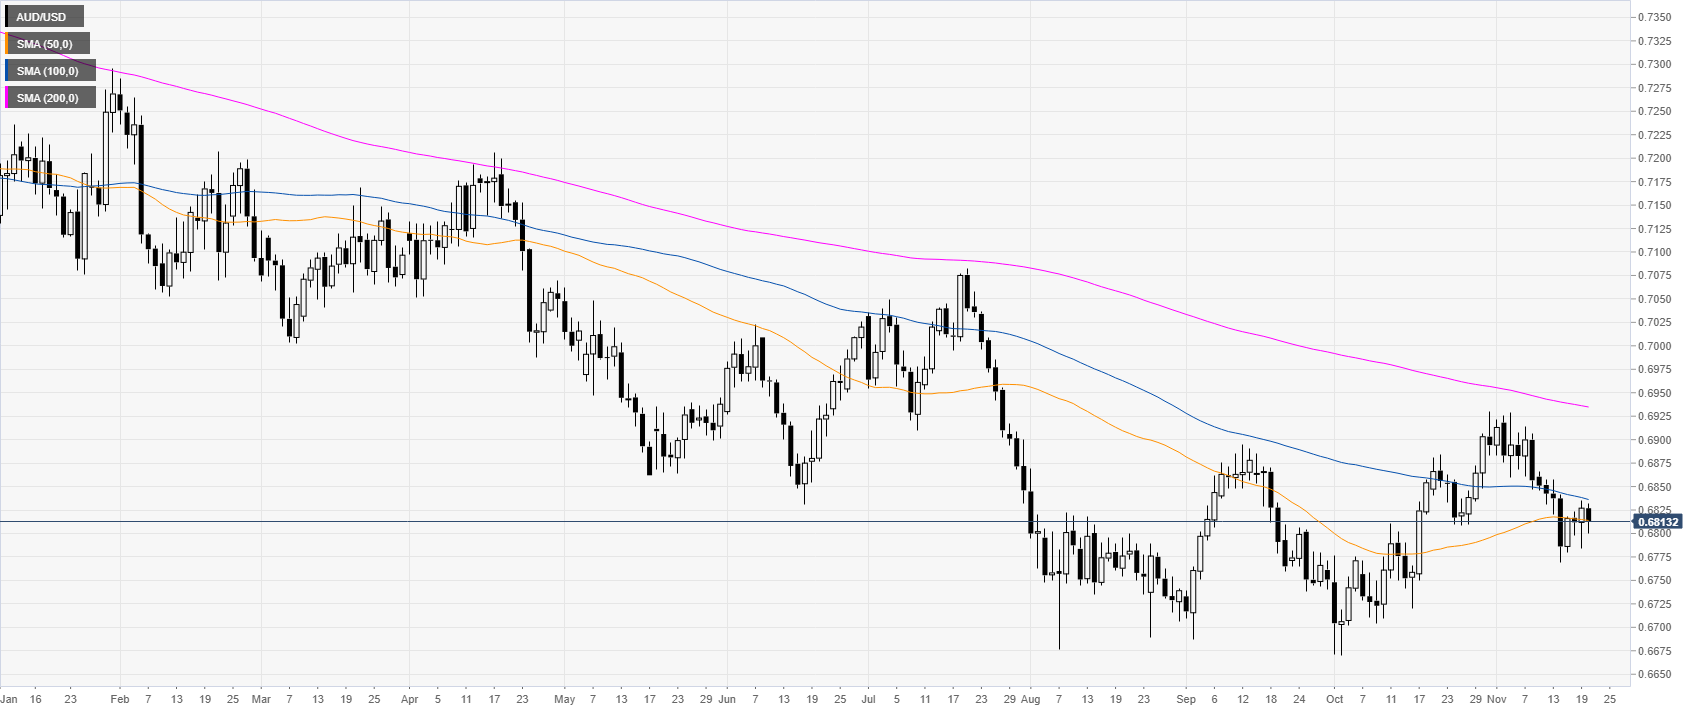
 

AUD/USD daily chart 

 
AUD/USD is trading in a bear trend below the 100 and 200-day simple moving averages (DMAs) on the daily chart. This Wednesday, the Aussie is trapped in a tight range ahead of the FOMC minutes at 19:00 GMT. 
 

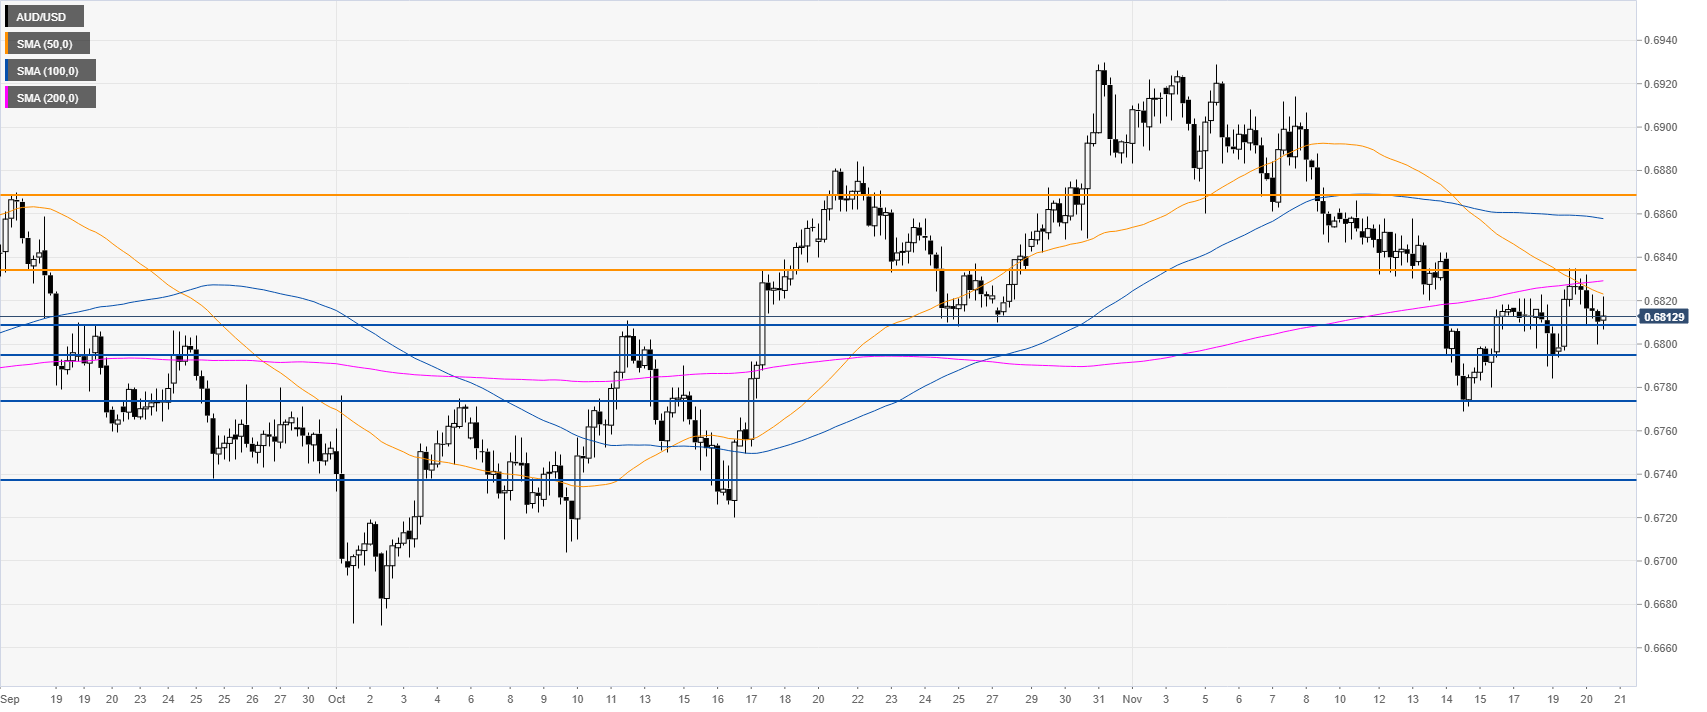
AUD/USD 4-hour chart

 
The market is trading below 0.6835 resistance and the main SMAs, suggesting a bearish bias in the medium term. A break below the 0.6809 support can lead to the 0.6795 and 0.6773 price levels, according to the Technical Confluences Indicator. 
 

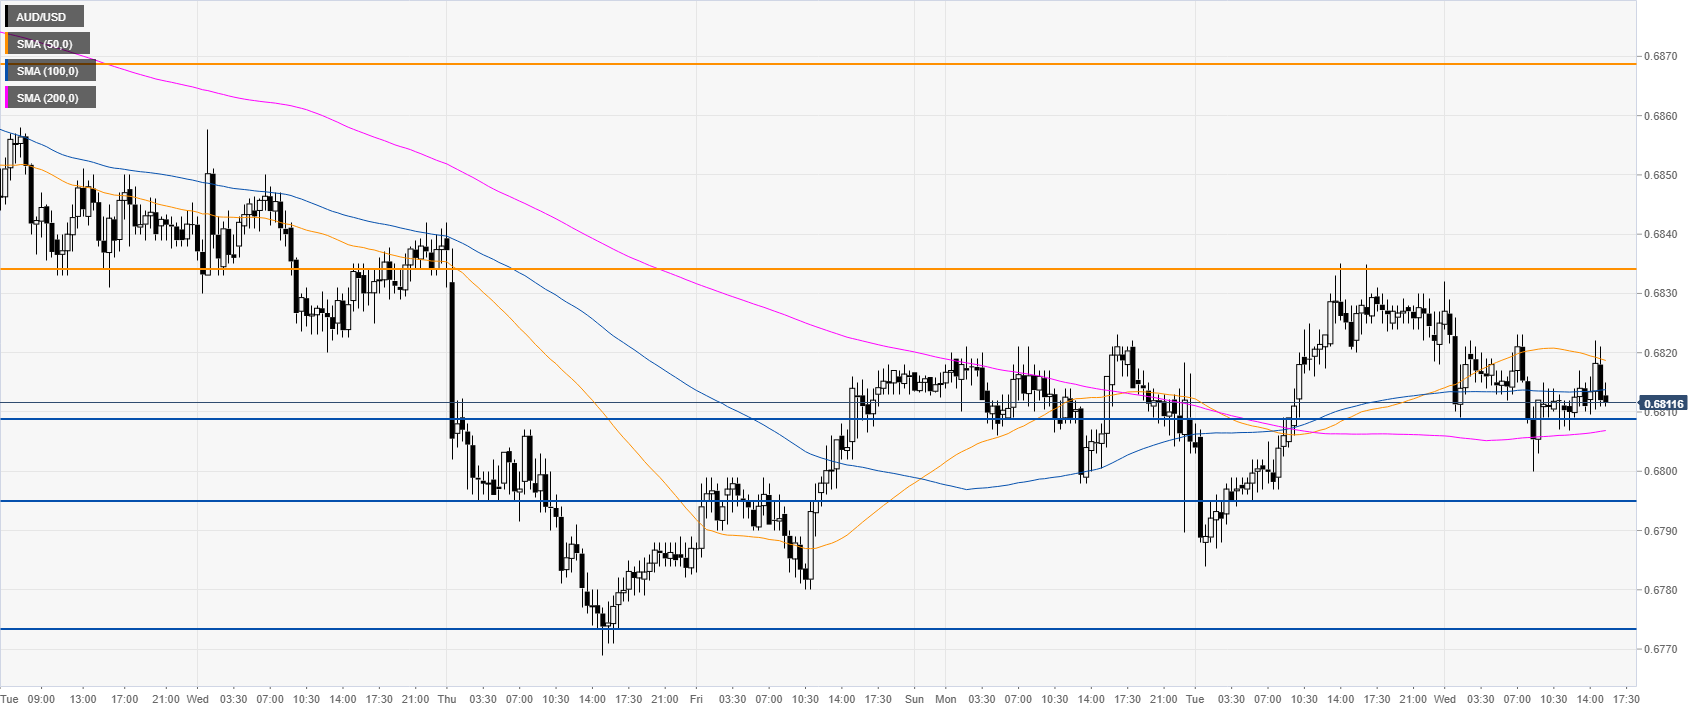
AUD/USD 30-minute chart 

 
AUD/USD is trading below the 50 SMA, while in the middle of its weekly range. Resistances are seen at the 0.6834 and 0.6868 price levels, according to the Technical Confluences Indicator. 
 

Additional key levels

AUD/USD

Overview
Today last price0.6812
Today Daily Change-0.0015
Today Daily Change %-0.22
Today daily open0.6827
 
Trends
Daily SMA200.6855
Daily SMA500.6815
Daily SMA1000.6838
Daily SMA2000.6936
 
Levels
Previous Daily High0.6835
Previous Daily Low0.6784
Previous Weekly High0.6866
Previous Weekly Low0.6769
Previous Monthly High0.693
Previous Monthly Low0.667
Daily Fibonacci 38.2%0.6816
Daily Fibonacci 61.8%0.6803
Daily Pivot Point S10.6796
Daily Pivot Point S20.6764
Daily Pivot Point S30.6745
Daily Pivot Point R10.6847
Daily Pivot Point R20.6866
Daily Pivot Point R30.6898

Author

Flavio Tosti

Flavio Tosti

Independent Analyst


More from Flavio Tosti
Share:

Editor's Picks

EUR/USD seems fragile below 1.1700 as Middle East war boosts energy prices

The EUR/USD pair trades flat at around 1.1680 during the Asian trading session on Tuesday, but broadly seems vulnerable, being close to its five-week low. The major currency pair is under pressure as surging oil prices due to the United States-Israel war with Iran have increased the risks of higher inflation for the Old Continent.

GBP/USD hovers around 1.3400 with bearish pressure intact

GBP/USD edges higher after three days of losses, trading around 1.3400 during the Asian hours on Tuesday. The technical analysis of the daily chart indicates an ongoing bearish bias, as the pair trades within a descending channel pattern.

Gold sticks to gains above $5,350 amid sustained safe-haven demand; firmer USD caps gains

Gold sticks to its positive bias for the third straight day and trades above the $5,350 level heading into the European session on Tuesday. Concerns about a broader regional conflict in the Middle East continue to weigh on investors' sentiment and underpin demand for the traditional safe-haven bullion.

Stellar risks deeper losses as derivatives metrics turn negative

Stellar is trading red below $0.16 at the time of writing on Tuesday, after a slight recovery the previous day. Weakening derivatives data caps the recovery, while an unfavorable technical outlook projects a deeper correction for the XLM token in the upcoming days.

The market is not panicking it is repricing the probability distribution of Oil and time

At the end of the day, markets do not trade morality or geopolitics. They trade transmission channels. And the only channel that truly matters in this maelstrom runs through the price of energy and the time value of money.

Hyperliquid Price Forecast: HYPE rises on commodities demand amid US-Iran war

Hyperliquid (HYPE) steadies above $33 at press time on Tuesday, marking its fourth consecutive day of recovery in a broadly volatile market due to the ongoing US-Israel strikes on Iran.