|

AUD/USD technical analysis: Aussie easing from daily highs, trading sub- 0.6770 level

  • AUD/USD is retracing down in the New York session after the inflation data in the United States. 
  • The US Core Consumer Price Index (CPI) came out as expected at 2.4% YoY. 
  • The level to beat for sellers is the 0.6752 support. 
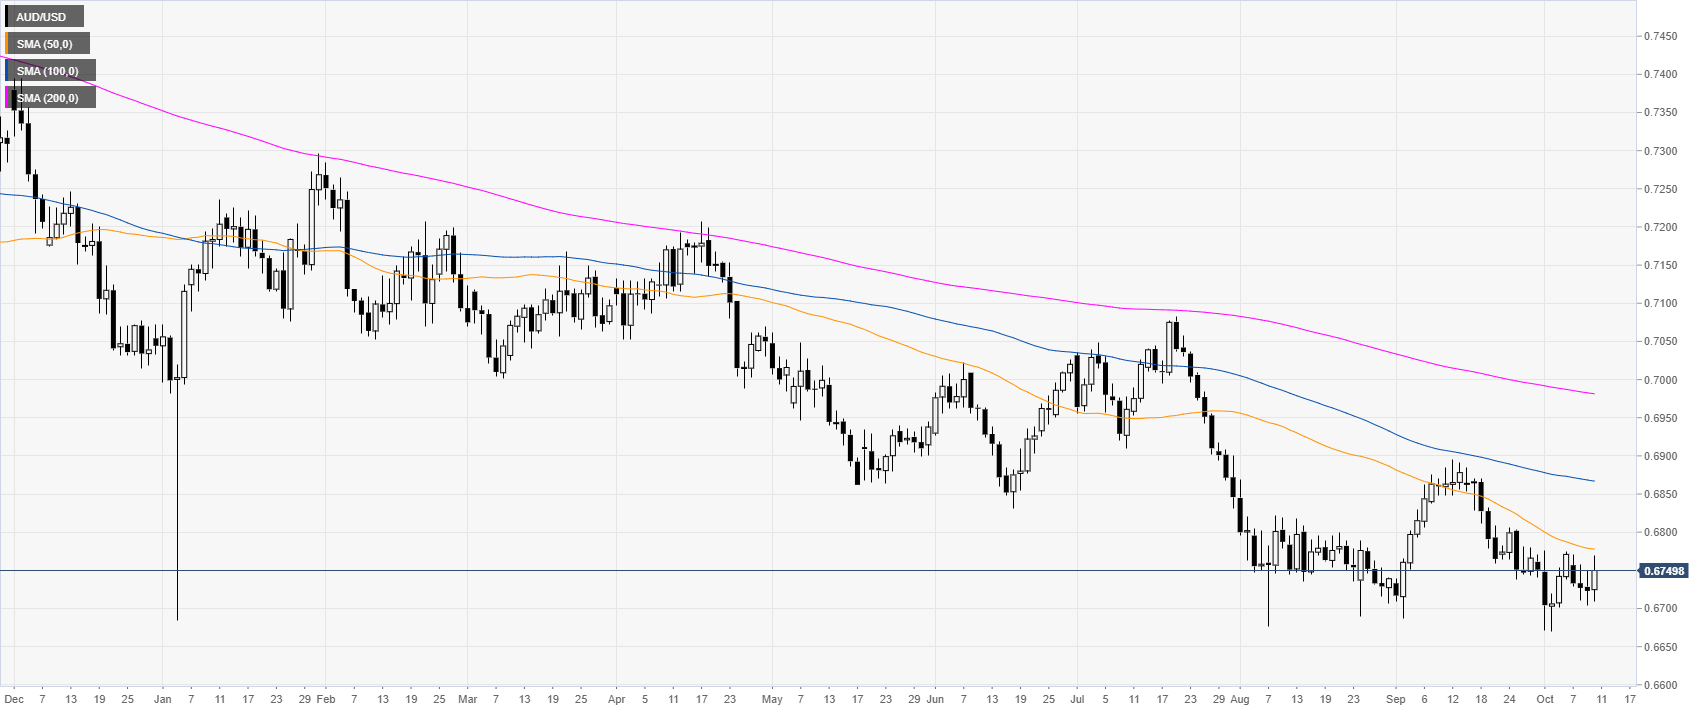
 

AUD/USD daily chart 

 
The Aussie is trading in a bear trend below the main daily simple moving averages (SMAs) on the daily chart. This Thursday, the US Core Consumer Price Index (CPI) came out as expected at 2.4% YoY. 


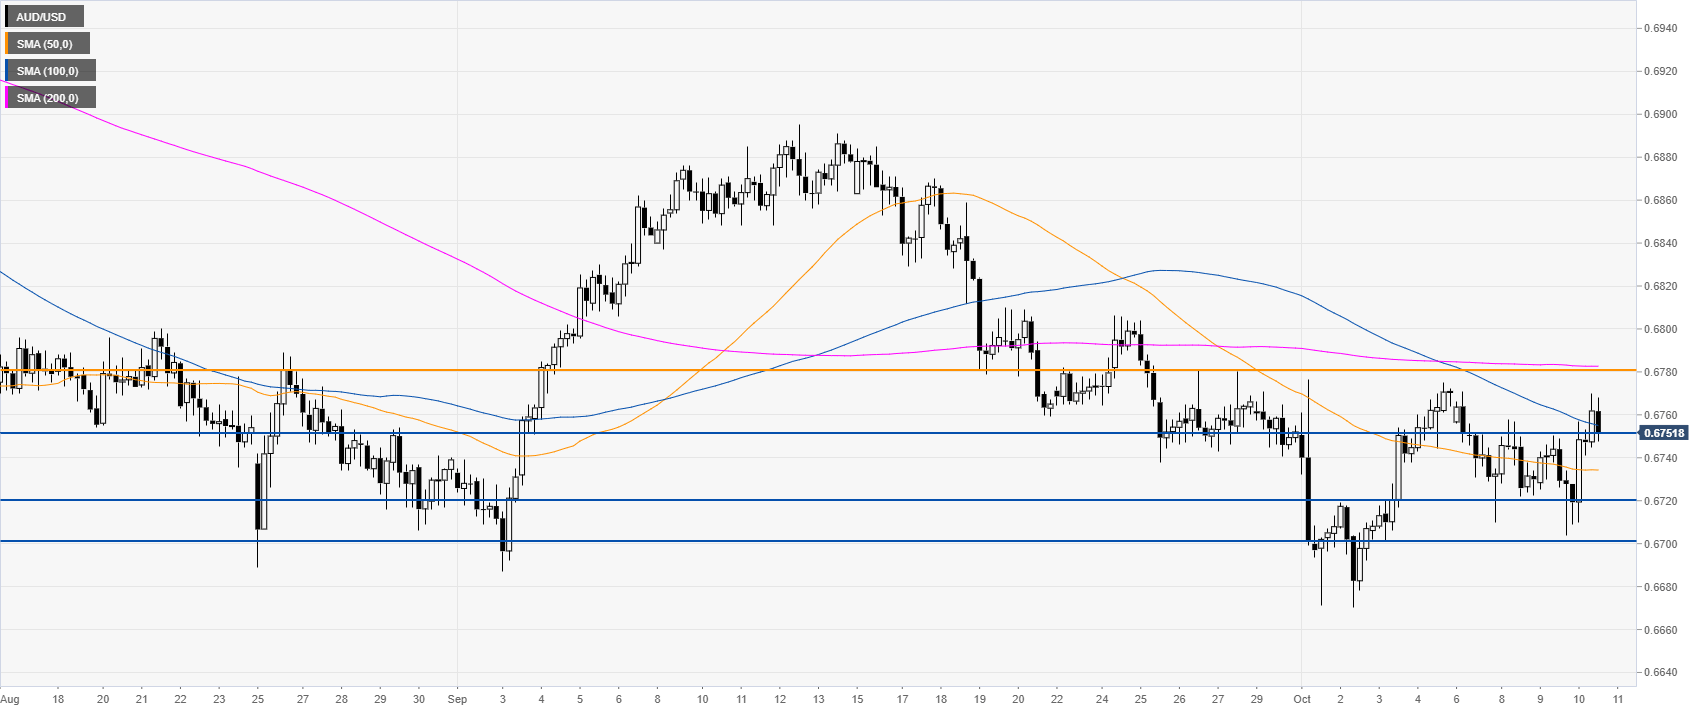
AUD/USD 4-hour chart

 
The AUD/USD exchange rate is trading between the 50 and 200 SMAs, suggesting a consolidation phase in the medium term. The market is challenging the 0.6752 support. A break below the level can see the Aussie going back to the 0.6720/0.6700 support zone, according to the Technical Confluences Indicator.

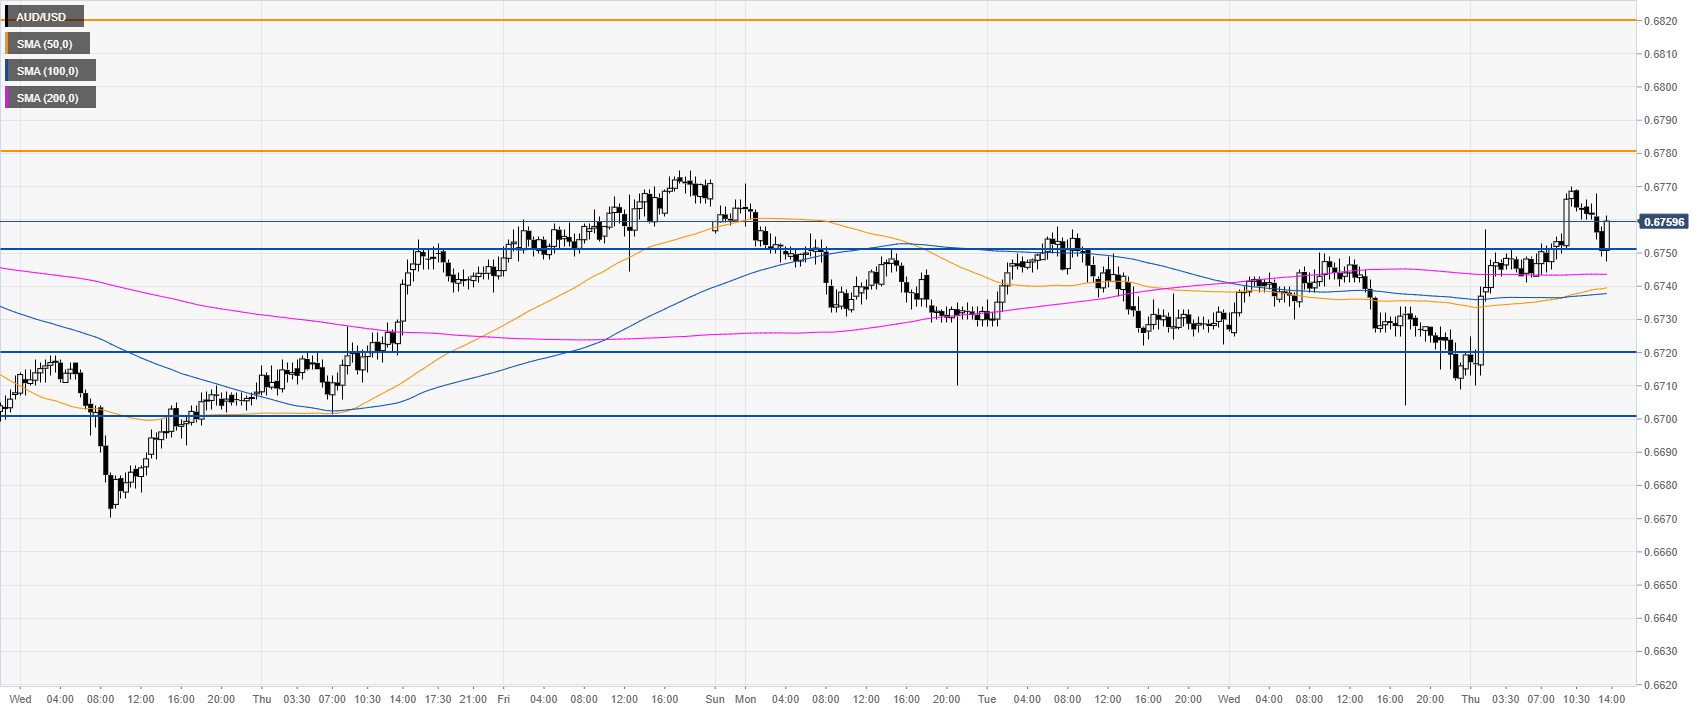
AUD/USD 30-minute chart

 
AUD/USD is trading above the main SMAs on the 30-minute chart, suggesting bullish momentum in the near term. Immediate resistances are seen at the 0.6780 and 0.6820 price levels. 

Additional key levels

AUD/USD

Overview
Today last price0.675
Today Daily Change0.0027
Today Daily Change %0.40
Today daily open0.6723
 
Trends
Daily SMA200.6778
Daily SMA500.6779
Daily SMA1000.6868
Daily SMA2000.6983
 
Levels
Previous Daily High0.675
Previous Daily Low0.6704
Previous Weekly High0.6776
Previous Weekly Low0.667
Previous Monthly High0.6895
Previous Monthly Low0.6687
Daily Fibonacci 38.2%0.6722
Daily Fibonacci 61.8%0.6733
Daily Pivot Point S10.6701
Daily Pivot Point S20.6679
Daily Pivot Point S30.6655
Daily Pivot Point R10.6748
Daily Pivot Point R20.6772
Daily Pivot Point R30.6794

Author

Flavio Tosti

Flavio Tosti

Independent Analyst


More from Flavio Tosti
Share:

Editor's Picks

EUR/USD hits two-day highs near 1.1820

EUR/USD picks up pace and reaches two-day tops around 1.1820 at the end of the week. The pair’s move higher comes on the back of renewed weakness in the US Dollar amid growing talk that the Fed could deliver an interest rate cut as early as March. On the docket, the flash US Consumer Sentiment improves to 57.3 in February.

GBP/USD reclaims 1.3600 and above

GBP/USD reverses two straight days of losses, surpassing the key 1.3600 yardstick on Friday. Cable’s rebound comes as the Greenback slips away from two-week highs in response to some profit-taking mood and speculation of Fed rate cuts. In addition, hawkish comments from the BoE’s Pill are also collaborating with the quid’s improvement.

Gold climbs further, focus is back to 45,000

Gold regains upside traction and surpasses the $4,900 mark per troy ounce at the end of the week, shifting its attention to the critical $5,000 region. The move reflects a shift in risk sentiment, driving flows back towards traditional safe haven assets and supporting the yellow metal.

Crypto Today: Bitcoin, Ethereum, XRP rebound amid risk-off, $2.6 billion liquidation wave

Bitcoin edges up above $65,000 at the time of writing on Friday, as dust from the recent macro-triggered sell-off settles. The leading altcoin, Ethereum, hovers above $1,900, but resistance at $2,000 caps the upside. Meanwhile, Ripple has recorded the largest intraday jump among the three assets, up over 10% to $1.35.

Three scenarios for Japanese Yen ahead of snap election

The latest polls point to a dominant win for the ruling bloc at the upcoming Japanese snap election. The larger Sanae Takaichi’s mandate, the more investors fear faster implementation of tax cuts and spending plans. 

XRP rally extends as modest ETF inflows support recovery

Ripple is accelerating its recovery, trading above $1.36 at the time of writing on Friday, as investors adjust their positions following a turbulent week in the broader crypto market. The remittance token is up over 21% from its intraday low of $1.12.