|
AUD/USD technical analysis: Aussie chopping around ahead of the RBA Meeting Minutes
- AUD/USD is trading near daily lows as the market chopped around for most of the session.
- The level to beat for bears is the 0.6848 support level.
- The Reserve Bank of Australia (RBA) will be releasing its Meeting Minutes on Tuesday at 1:30 GMT.

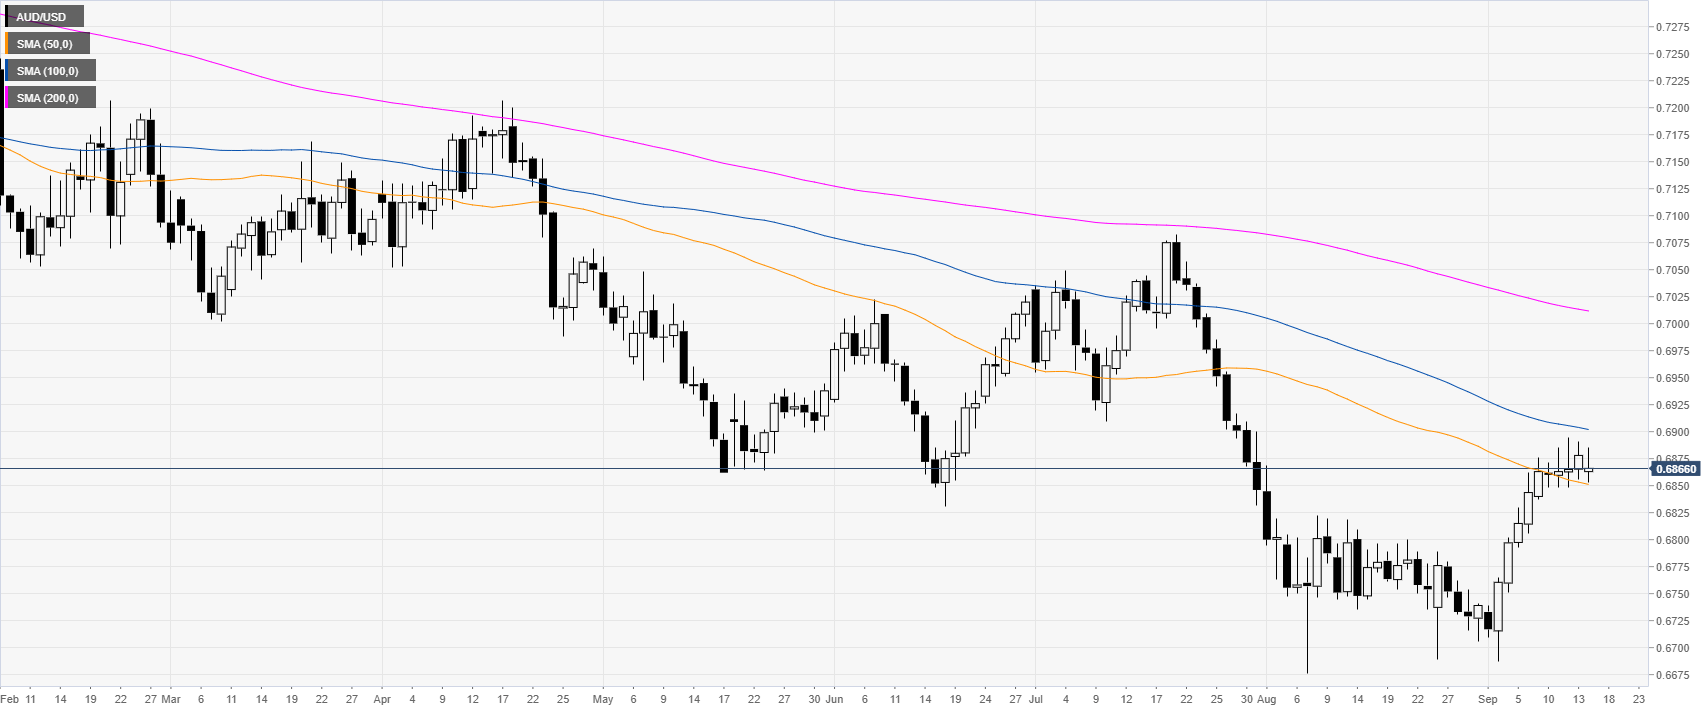
AUD/USD daily chart
The AUD/USD currency pair is trading in a bear trend below the 100 and 200-day simple moving averages (SMAs). However, throughout September, the market has been rebounding sharply.
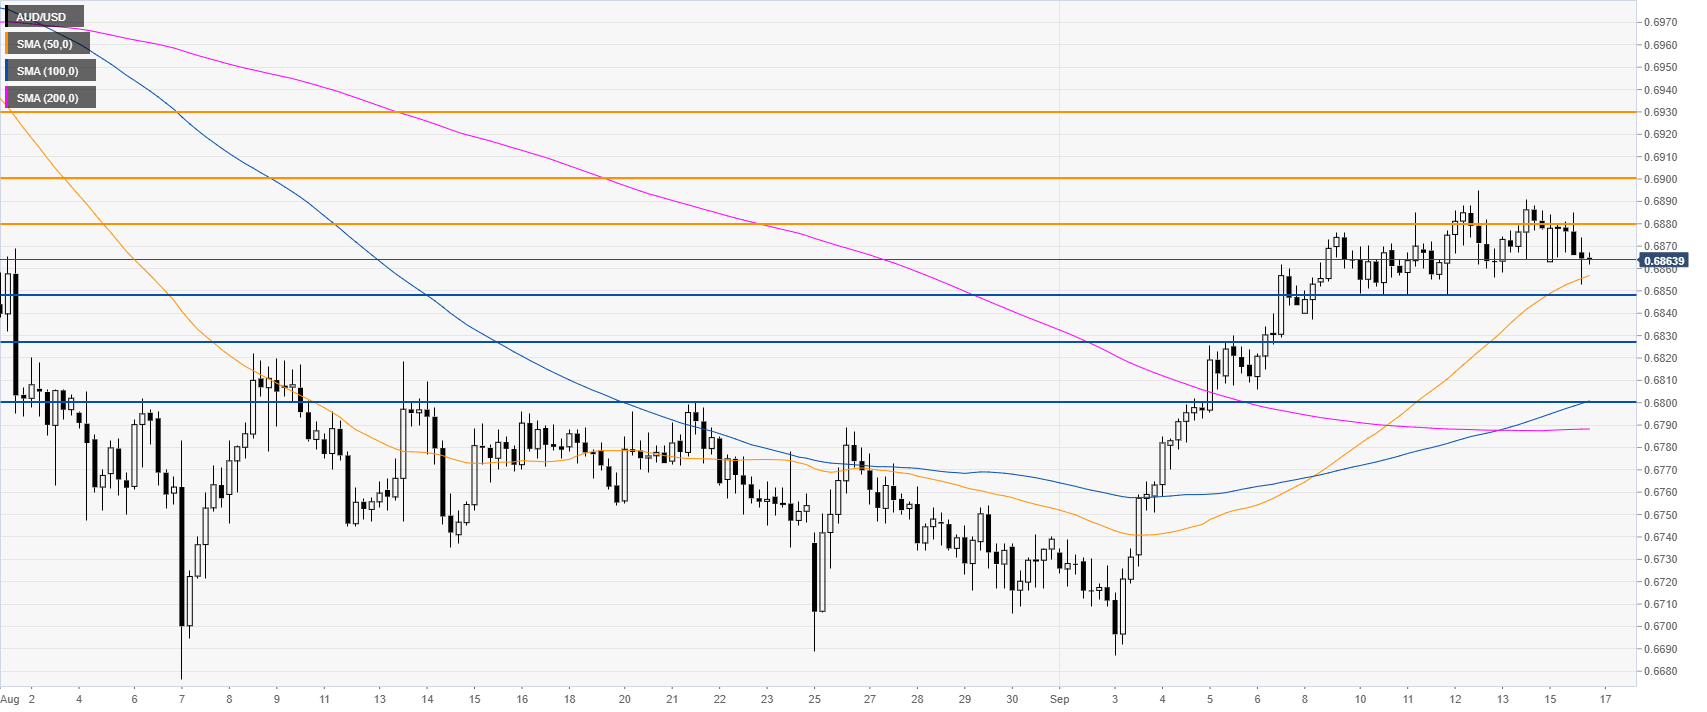
AUD/USD 4-hour chart
The Aussie is trading above its main simple moving averages (SMAs), suggesting bullish momentum in the near term. However, the market tested the 50 SMA as little to no progress has been made this Monday on the bullish side. The Aussie will need a daily close above 0.6900 resistance to extend the bull run towards 0.6930, according to the Technical Confluences Indicator.
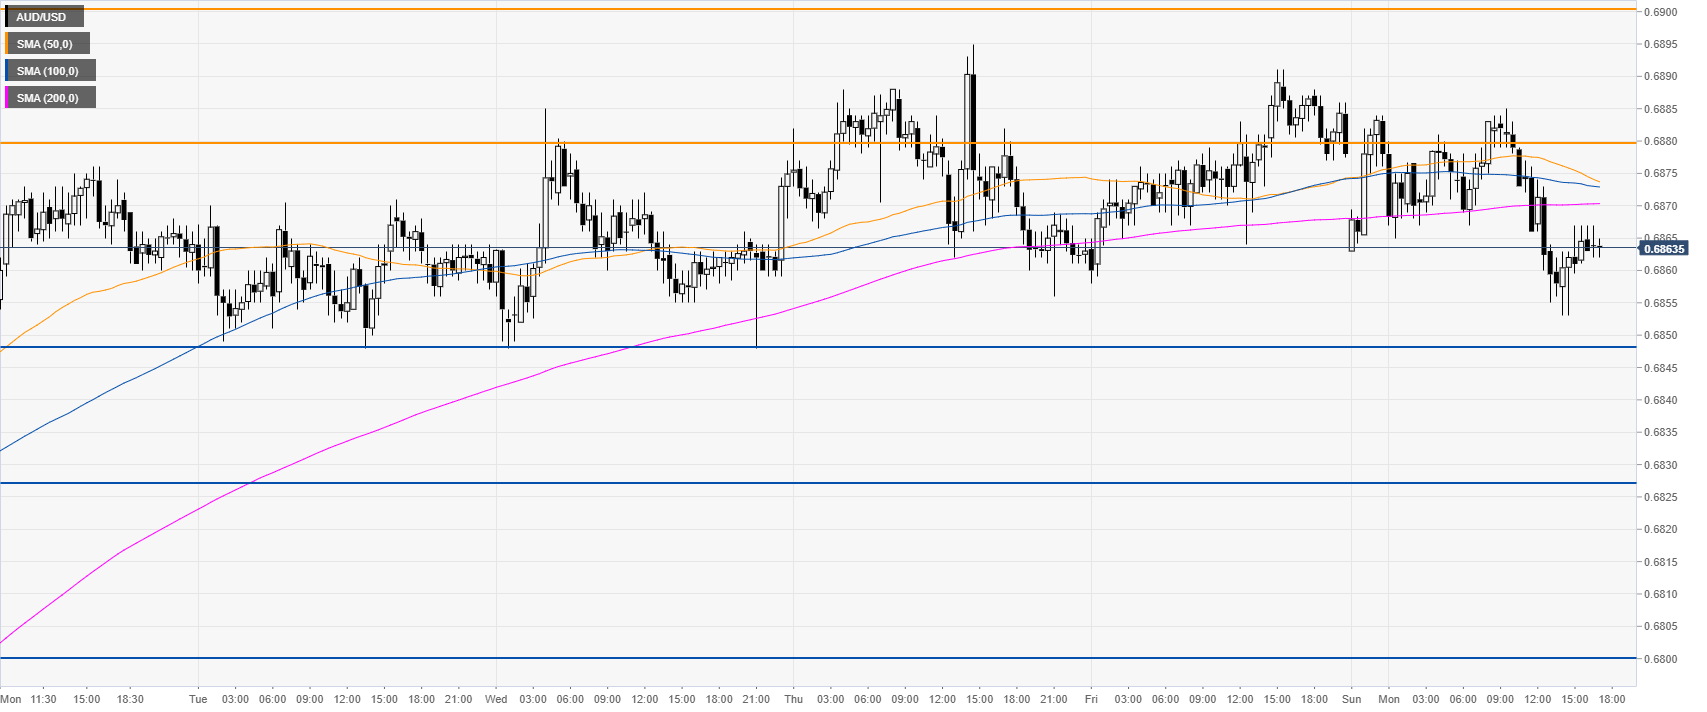
AUD/USD 30-minute chart
AUD/USD is trading near daily lows below its main SMAs, suggesting a bearish bias in the near term. If the 0.6848support gives way to a bearish incursion, the 0.6827 and 0.6800 levels can become the next support levels on the way down, according to the Technical Confluences Indicator.
Additional key levels
Author

Flavio Tosti
Independent Analyst
More from Flavio Tosti


