AUD/USD spikes back above 0.6660 as dovish Fed sends US Dollar tumbling
- The AUD/USD is back into the high side after the Fed signals the end of rate hikes.
- FOMC rate outlook sees three rate cuts in 2024.
- Aussie sees strong Wednesday performance against weakening Greenback.

The AUD/USD is catching a firm risk-bid as markets surge higher following a dovish pivot to the Federal Reserve’s (Fed) policy stance; the Fed now sees at least three rate cuts in 2024, for a combined 75 basis points in rate cuts next year.
Powell speech: Difference in projections reflect lower inflation than previously expected
The Australian Dollar (AUD) is one of the best-performing currencies of the majors bloc on Wednesday, seeing a firm bullish break to climb 1.5% against the US Dollar (USD) on the day. The Fed’s dot plot adjustment on Wednesday still falls well short of market expectations, but does a good job of meeting investors at the halfway mark: money markets are currently pricing in a combined 140 basis points of rate cuts for 2024, with the first cut potentially expected as soon as the March Fed meeting.
Read More: Jerome Powell speaks on policy outlook after holding policy rate steady
With the Fed easing back from its hawkish policy stance in the face of steadily declining inflation, broad-market risk appetite is rebounding heading into the latter half of the trading week.
Fed Statement comparison: December vs November
The economic calendar still isn’t done with the AUD/USD this week; early Thursday sees Australian labor figures, to be followed up by US Retail Sales and US S&P Global Purchasing Manager Index (PMI) figures heading into Friday.
There’s still plenty of time left in the trading week for the Aussie to squander its lead against the US Dollar, with the Australian Unemployment Rate expected to tick up from 3.7% to 3.8% in November, while Australian jobs additions are forecast to slump to 11K in November from October’s 55K print.
US Retail Sales for November are expected to print at -0.1%, a minor decline but in-line with October’s -0.1%.
December’s US PMI figures are forecast to see slight declines in both the Services and Manufacturing components; US Services PMI is forecast to print at 49.3 versus the previous 49.4, while the Manufacturing PMI is seen declining slightly from 50.8 to 50.6.
Australian Dollar price today
The table below shows the percentage change of Australian Dollar (AUD) against listed major currencies today. Australian Dollar was the strongest against the US Dollar.
| USD | EUR | GBP | CAD | AUD | JPY | NZD | CHF | |
| USD | -0.75% | -0.43% | -0.61% | -1.50% | -1.54% | -1.05% | -0.46% | |
| EUR | 0.78% | 0.36% | 0.19% | -0.71% | -0.74% | -0.27% | 0.33% | |
| GBP | 0.37% | -0.37% | -0.18% | -1.12% | -1.11% | -0.63% | -0.09% | |
| CAD | 0.60% | -0.14% | 0.18% | -0.91% | -0.93% | -0.46% | 0.12% | |
| AUD | 1.50% | 0.74% | 1.10% | 0.93% | 0.00% | 0.49% | 1.02% | |
| JPY | 1.53% | 0.72% | 1.11% | 0.92% | -0.04% | 0.49% | 1.02% | |
| NZD | 1.00% | 0.27% | 0.63% | 0.45% | -0.48% | -0.52% | 0.55% | |
| CHF | 0.46% | -0.28% | 0.08% | -0.09% | -1.03% | -1.03% | -0.55% |
The heat map shows percentage changes of major currencies against each other. The base currency is picked from the left column, while the quote currency is picked from the top row. For example, if you pick the Euro from the left column and move along the horizontal line to the Japanese Yen, the percentage change displayed in the box will represent EUR (base)/JPY (quote).
AUD/USD Technical Outlook
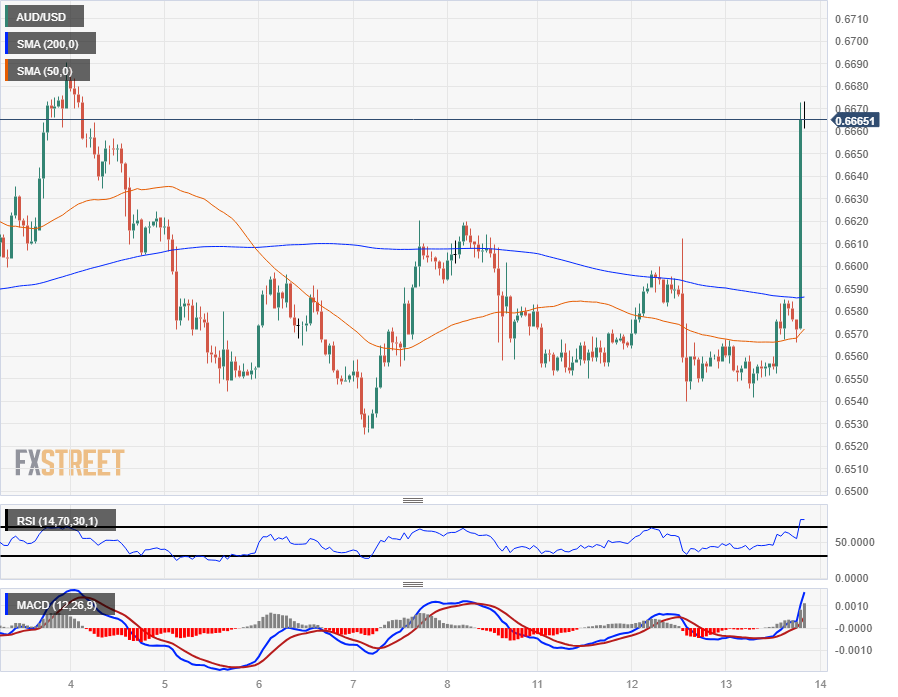
The AUD/USD has seen a hard rally on the intraday charts, breaking through and soaring well above the 200-hour Simple Moving Average (SMA) just below 0.67590, and bids are now testing back into the 0.6660 and within reach range of December's peak bids near 0.6690, with the 0.6700 handle just beyond that.
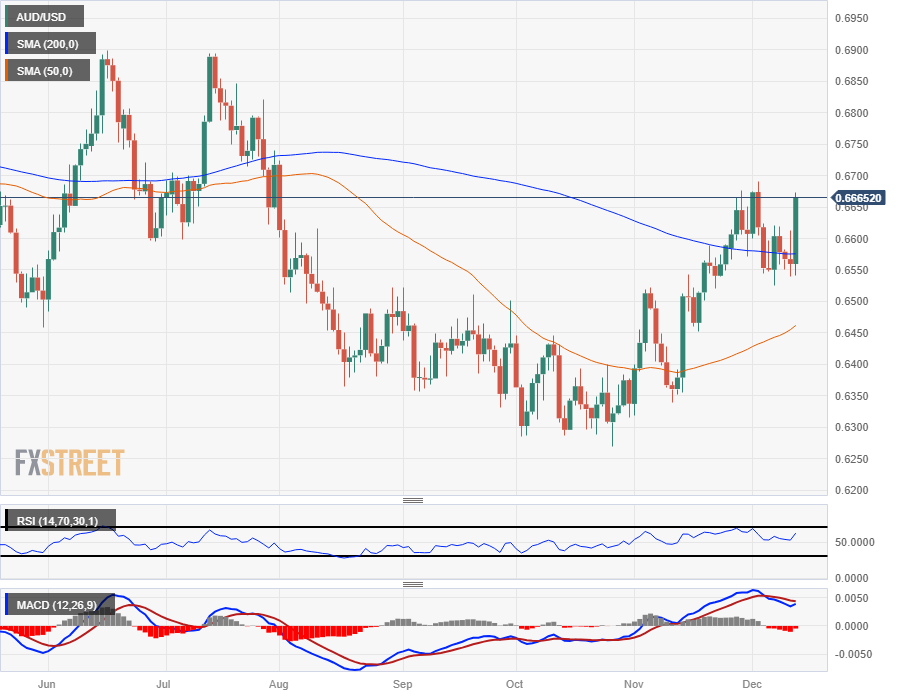
0.6550 is forming up into a significant technical floor for the AUD/USD, etching in a technical higher low in the pair's medium-term trend that has the Aussie rising from October's bottom bids near the 0.6300 handle.
The AUD/USD is testing into familiar consolidation territory that plagued the pair in the early half of 2023, and bulls will be looking to capitalize off of any technical pullbacks towards the 200-day SMA which is currently near 0.6575.
AUD/USD Hourly Chart
AUD/USD Daily Chart
AUD/USD Technical Levels
Author

Joshua Gibson
FXStreet
Joshua joins the FXStreet team as an Economics and Finance double major from Vancouver Island University with twelve years' experience as an independent trader focusing on technical analysis.

















