|

AUD/USD Price Prediction: Weekly chart shows bearish Tweezer Top nearly confirmed

  • AUD/USD rose to the top of its long-term range, formed a bearish Tweezer Top and has weakened. 
  • This is a bearish sign that suggests a reversal down is set to unfold. 

AUD/USD rose up to the top of its range during the summer in a three-wave ABC pattern (see chart) and then formed a bearish Tweezer Top Japanese candlestick reversal pattern on the weekly chart (orange-shaded circled on chart).


AUD/USD Weekly Chart 


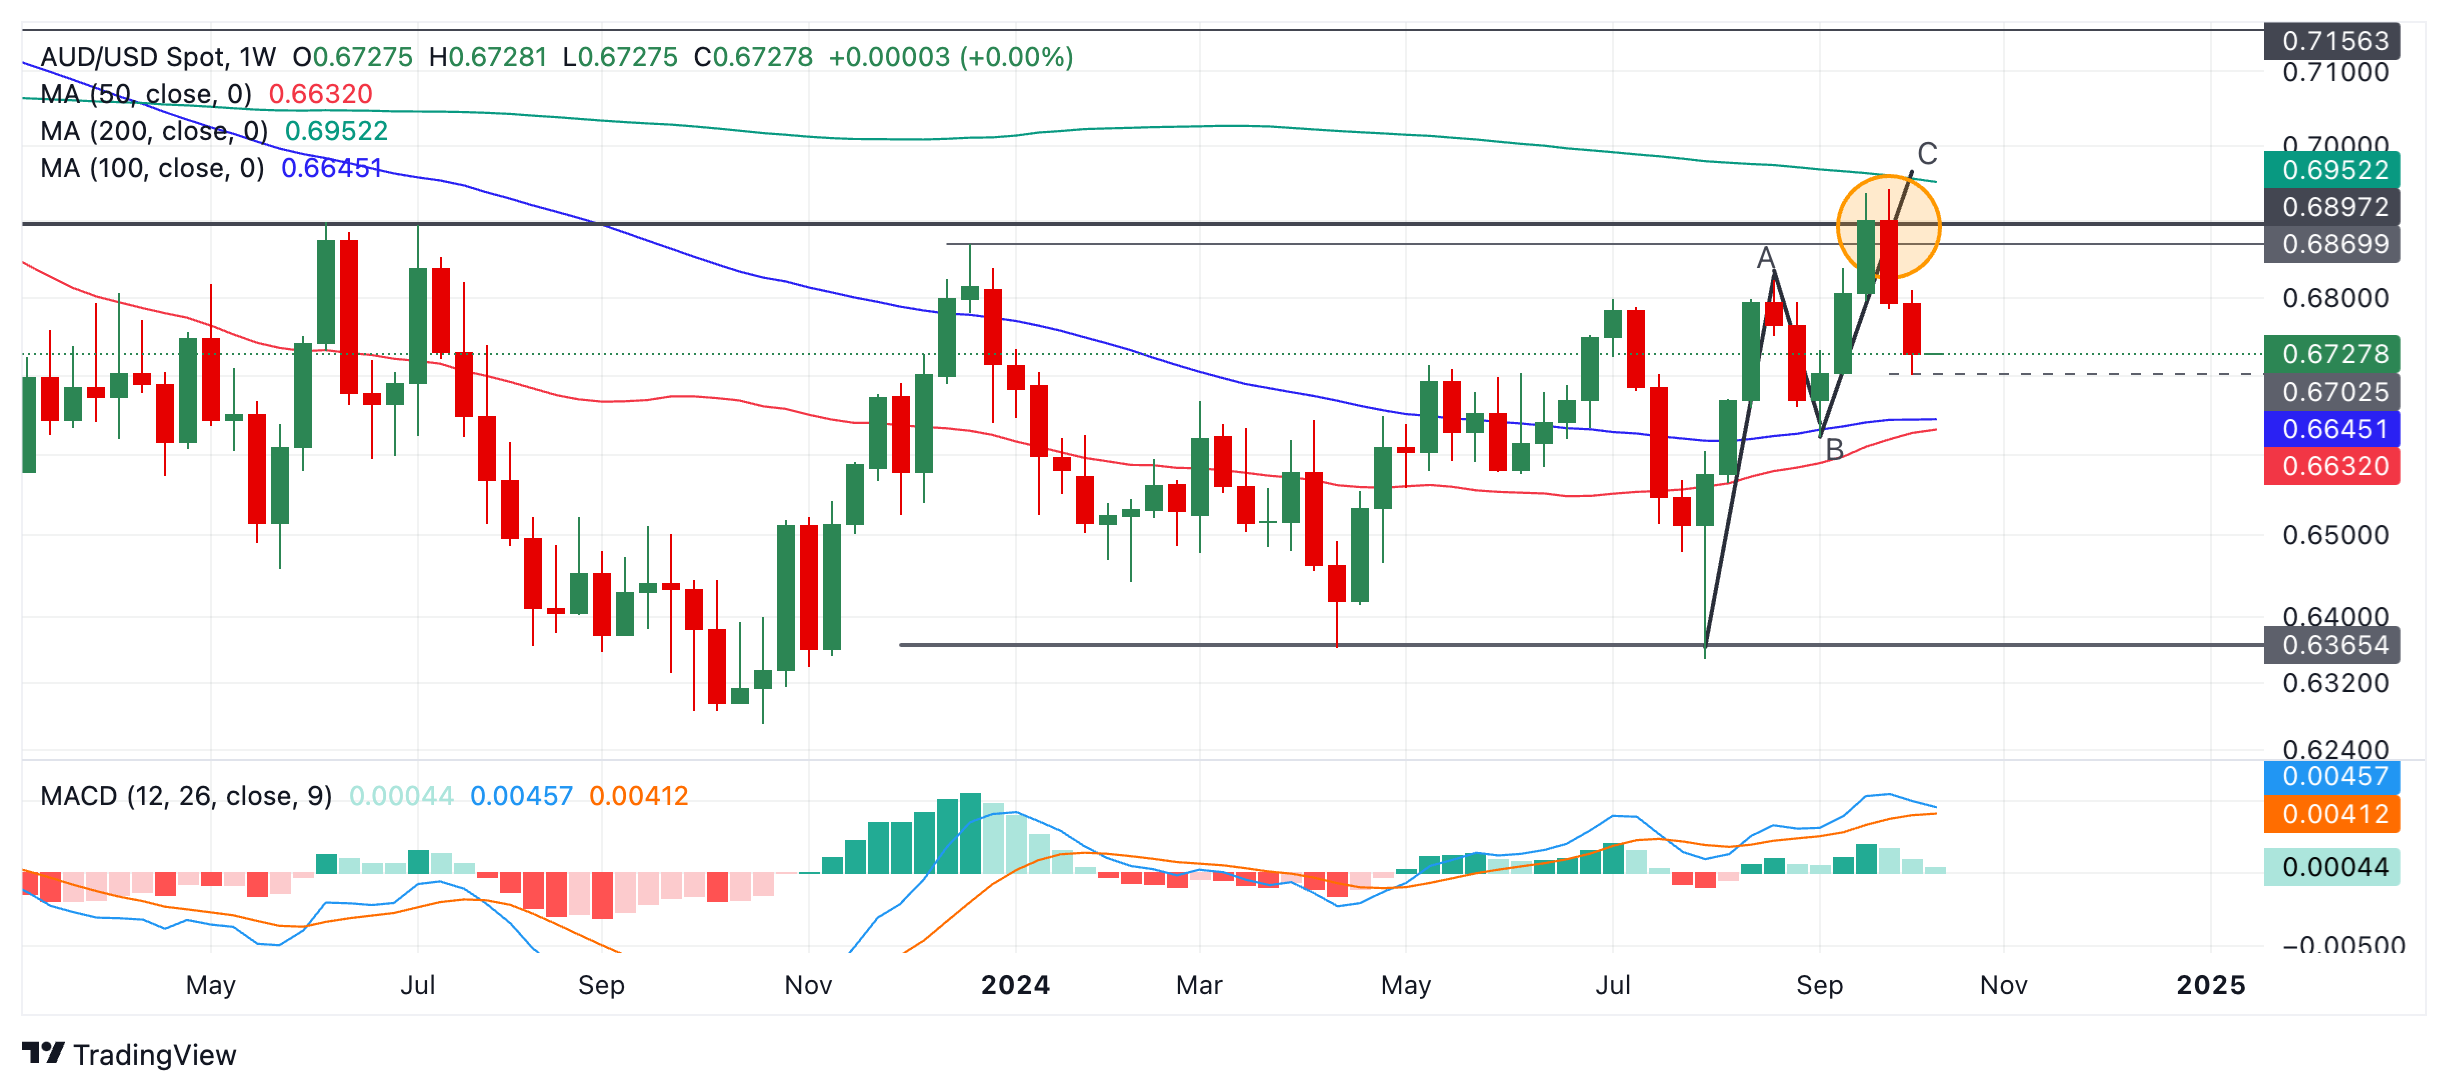
This pattern occurs at the end of an up move when two consecutive bars peak at the same or a similar level and both have a similar length “wick”. The wick is the range that sticks out above the full body of the candle. The two candlest taken together thus resemble a “tweezer”. 

In the following week the pair has sold off, so far, and assuming the week ends as a red down candlestick (today is Friday), it will provide added bearish confirmation for the Tweezer Top. 

The long-term trend is sideways since the pair has been moving in a range for over a year. Given the principle that “the trend is your friend” the odds favor a continuation of this trend. In this case, this would imply the next move ought to be a down leg back towards the range floor. 

A break below 0.6701 (week’s lows) would provide bearish confirmation to an initial target at the cluster of major moving averages at between 0.6645 and 0.6632. 

A further break below the bottom of wave B at 0.6622 would probably signal an even deeper sell-off down to a target at 0.6400 and the range lows. 

Author

Joaquin Monfort

Joaquin Monfort is a financial writer and analyst with over 10 years experience writing about financial markets and alt data. He holds a degree in Anthropology from London University and a Diploma in Technical analysis.

More from Joaquin Monfort
Share:

Markets move fast. We move first.

Orange Juice Newsletter brings you expert driven insights - not headlines. Every day on your inbox.

By subscribing you agree to our Terms and conditions.

Editor's Picks

EUR/USD bounces toward 1.1750 as US Dollar loses strength

EUR/USD returned to the 1.1750 price zone in the American session on Friday, despite falling Wall Street, which indicates risk aversion. Trading conditions remain thin following the New Year holiday and ahead of the weekend, with the focus shifting to US employment and European data scheduled for next week.

GBP/USD nears 1.3500, holds within familiar levels

After testing 1.3400 on the last day of 2025, GBP/USD managed to stage a rebound. Nevertheless, the pair finds it difficult to gather momentum and trades with modest intraday gains at around 1.3490 as market participants remain in holiday mood.

Gold trims intraday gains, approaches $4,300

Gold retreated sharply from the $4,400  area and trades flat for the day in the $4,320 price zone. Choppy trading conditions exacerbated the intraday decline, although XAU/USD bearish case is out of the picture, considering growing expectations for a dovish Fed and persistent geopolitical tensions.

Cardano gains early New Year momentum, bulls target falling wedge breakout

Cardano kicks off the New Year on a positive note and is extending gains, trading above $0.36 at the time of writing on Friday. Improving on-chain and derivatives data point to growing bullish interest, while the technical outlook keeps an upside breakout in focus.

Economic outlook 2026-2027 in advanced countries: Solidity test

After a year marked by global economic resilience and ending on a note of optimism, 2026 looks promising and could be a year of solid economic performance. In our baseline scenario, we expect most of the supportive factors at work in 2025 to continue to play a role in 2026.

Crypto market outlook for 2026

Year 2025 was volatile, as crypto often is.  Among positive catalysts were favourable regulatory changes in the U.S., rise of Digital Asset Treasuries (DAT), adoption of AI and tokenization of Real-World-Assets (RWA).