AUD/USD Price Forecast: Wobbles around 0.6300
- AUD/USD trades in a tight range around 0.6300 as investors sideline amid fears of reciprocal tariffs by US President Trump.
- Trump announces 25% tariffs on imported cars, which will be effective from April 2.
- The Chinese government vowed more fiscal support to stimulate the domestic economy.

The AUD/USD pair trades sideways around 0.6300 in Thursday’s North American session. The Aussie pair consolidates even though the US Dollar (USD) corrects after the United States (US) President Donald Trump announced 25% tariffs on auto imports, which will come into effect on April 2.
The US Dollar Index (DXY), which tracks the Greenback’s value against six major currencies, slumps to near 104.30.
Theoretically, Donald Trump’s tariffs should increase the US Dollar’s safe-haven appeal as they are expected to weigh on global economic growth. Investors expect these import duties also to be unfavorable for US growth prospects.
Investors brace for more volatility in the US Dollar as Trump is prepared to introduce reciprocal tariffs on April 2, which are expected to boost inflationary pressures in the US and its trading allies.
On the monetary policy front, Federal Reserve (Fed) officials have been guiding a 'wait and see' approach amid uncertainty over Trump’s economic policies. Minneapolis Fed Bank President Neel Kashkari said at the Detroit Lakes Chamber Economic Summit on Wednesday that the Fed should "just sit where we are for an extended period of time until we get clarity."
Meanwhile, the Australian Dollar (AUD) struggles against the Greenback even though Beijing has promised strong monetary support to stimulate economic growth. “More proactive and effective macroeconomic policies will be implemented to comprehensively expand domestic demand and stabilise foreign trade and investment," Chinese Vice Premier Ding Xuexiang said on Thursday. The appeal of the AUD increases, given Australia’s higher dependency on exports to China.
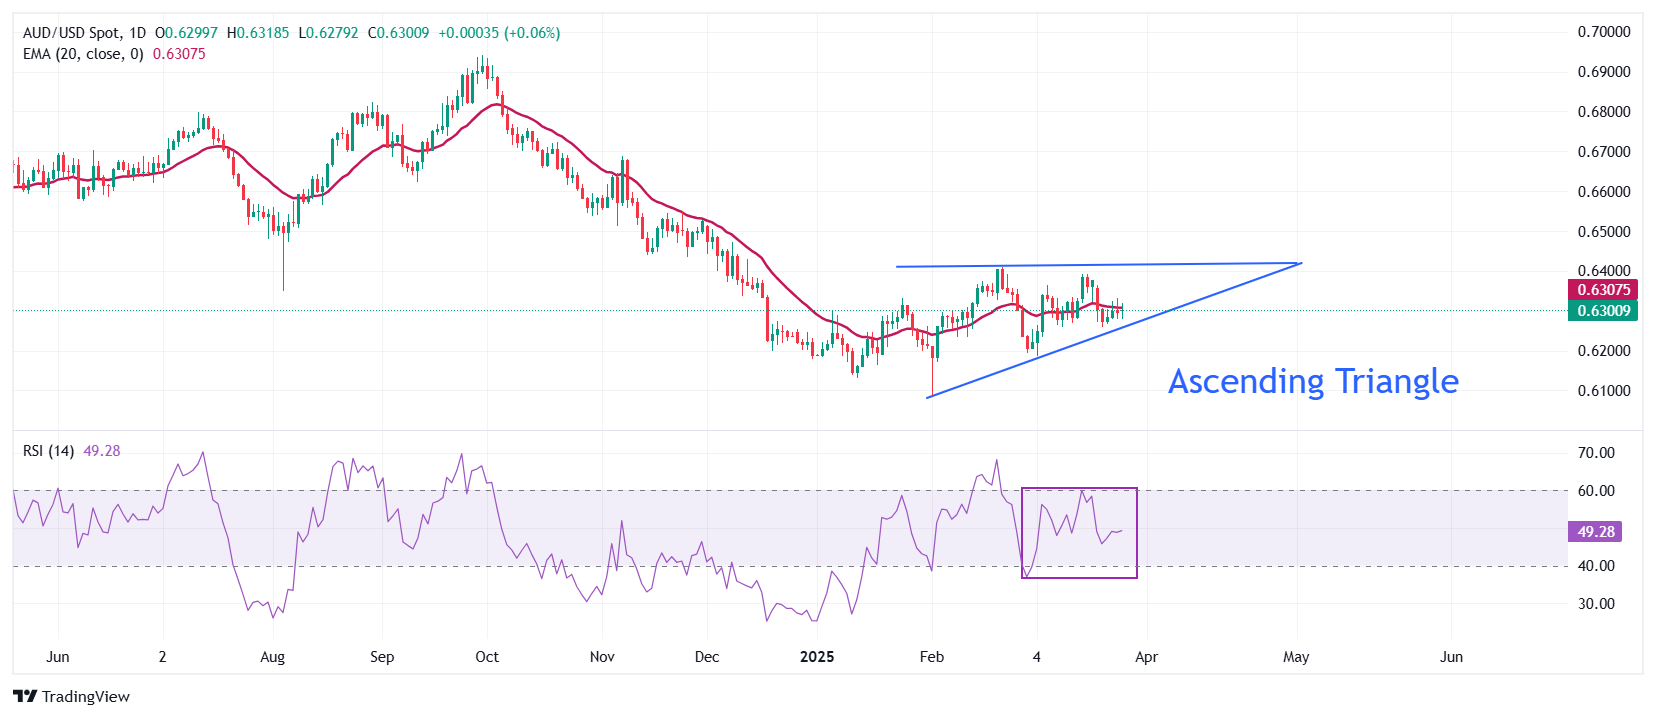
AUD/USD trades in an Ascending Triangle chart pattern formation on the daily timeframe, which indicates indecisiveness among market participants. The horizontal resistance of the above-mentioned chart pattern is placed from the February 21 high of 0.6408, while the upward-sloping border is plotted from the February low of 0.6087.
The 20-day Exponential Moving Average (EMA) seems sticky to the pair around 0.6300, suggesting a sideways trend.
The 14-day Relative Strength Index (RSI) oscillates inside the 40.00-60.00 range, which indicates a volatility contraction.
A fresh downside would appear if the pair breaks below the March 4 low of 0.6187 towards the February low of 0.6087, followed by the psychological support of 0.6000.
On the flip side, a sustenance move above the March 18 high of 0.6390 will open doors to the December 5 high of 0.6456 and the round-level resistance of 0.6500.
AUD/USD daily chart
Australian Dollar FAQs
One of the most significant factors for the Australian Dollar (AUD) is the level of interest rates set by the Reserve Bank of Australia (RBA). Because Australia is a resource-rich country another key driver is the price of its biggest export, Iron Ore. The health of the Chinese economy, its largest trading partner, is a factor, as well as inflation in Australia, its growth rate and Trade Balance. Market sentiment – whether investors are taking on more risky assets (risk-on) or seeking safe-havens (risk-off) – is also a factor, with risk-on positive for AUD.
The Reserve Bank of Australia (RBA) influences the Australian Dollar (AUD) by setting the level of interest rates that Australian banks can lend to each other. This influences the level of interest rates in the economy as a whole. The main goal of the RBA is to maintain a stable inflation rate of 2-3% by adjusting interest rates up or down. Relatively high interest rates compared to other major central banks support the AUD, and the opposite for relatively low. The RBA can also use quantitative easing and tightening to influence credit conditions, with the former AUD-negative and the latter AUD-positive.
China is Australia’s largest trading partner so the health of the Chinese economy is a major influence on the value of the Australian Dollar (AUD). When the Chinese economy is doing well it purchases more raw materials, goods and services from Australia, lifting demand for the AUD, and pushing up its value. The opposite is the case when the Chinese economy is not growing as fast as expected. Positive or negative surprises in Chinese growth data, therefore, often have a direct impact on the Australian Dollar and its pairs.
Iron Ore is Australia’s largest export, accounting for $118 billion a year according to data from 2021, with China as its primary destination. The price of Iron Ore, therefore, can be a driver of the Australian Dollar. Generally, if the price of Iron Ore rises, AUD also goes up, as aggregate demand for the currency increases. The opposite is the case if the price of Iron Ore falls. Higher Iron Ore prices also tend to result in a greater likelihood of a positive Trade Balance for Australia, which is also positive of the AUD.
The Trade Balance, which is the difference between what a country earns from its exports versus what it pays for its imports, is another factor that can influence the value of the Australian Dollar. If Australia produces highly sought after exports, then its currency will gain in value purely from the surplus demand created from foreign buyers seeking to purchase its exports versus what it spends to purchase imports. Therefore, a positive net Trade Balance strengthens the AUD, with the opposite effect if the Trade Balance is negative.
Author

Sagar Dua
FXStreet
Sagar Dua is associated with the financial markets from his college days. Along with pursuing post-graduation in Commerce in 2014, he started his markets training with chart analysis.


