AUD/USD Price Forecast: On verge of 78.6% Fibo breakdown near 0.6950
- Australian Dollar is up against its major peers as RBA is seen on an extended hold.
- Australian Trade Surplus shrinks to A$495 million in August.
- Investors keenly await the US ISM Manufacturing PMI data for September.

The Australian Dollar (AUD) is up against its major currency pairs on Thursday, but is almost flat against the US Dollar (USD) at around 0.6948 in the early European trade. The antipodean outperforms even as market experts see the Reserve Bank of Australia (RBA) shifting to an extended hold after hiking its Official Cash Rate (OCR) four times this year by 25 basis points (bps) to 4.6%.
Australian Dollar Price Today
The table below shows the percentage change of Australian Dollar (AUD) against listed major currencies today. Australian Dollar was the strongest against the Japanese Yen.
| USD | EUR | GBP | JPY | CAD | AUD | NZD | CHF | |
|---|---|---|---|---|---|---|---|---|
| USD | 0.09% | 0.14% | 0.60% | 0.11% | -0.04% | 0.24% | 0.08% | |
| EUR | -0.09% | 0.04% | 0.50% | -0.03% | -0.14% | 0.13% | -0.01% | |
| GBP | -0.14% | -0.04% | 0.48% | -0.04% | -0.18% | 0.10% | -0.04% | |
| JPY | -0.60% | -0.50% | -0.48% | -0.52% | -0.65% | -0.40% | -0.53% | |
| CAD | -0.11% | 0.03% | 0.04% | 0.52% | -0.13% | 0.12% | -0.01% | |
| AUD | 0.04% | 0.14% | 0.18% | 0.65% | 0.13% | 0.29% | 0.15% | |
| NZD | -0.24% | -0.13% | -0.10% | 0.40% | -0.12% | -0.29% | -0.11% | |
| CHF | -0.08% | 0.01% | 0.04% | 0.53% | 0.00% | -0.15% | 0.11% |
The heat map shows percentage changes of major currencies against each other. The base currency is picked from the left column, while the quote currency is picked from the top row. For example, if you pick the Australian Dollar from the left column and move along the horizontal line to the US Dollar, the percentage change displayed in the box will represent AUD (base)/USD (quote).
RBA hike seen as likely the last as Bullock strikes dovish tone
Analysts at Standard Chartered Global Research note that the Reserve Bank of Australia (RBA) raised the cash rate to 4.60% at the 29 September meeting, “as we had expected (see RBA – Crossing the Rubicon) in a unanimous decision.” They highlight that the accompanying statement “cited the materialisation of upside risks to inflation but acknowledged slowing economic growth, easing labour-market conditions and falling housing prices,” while still keeping “the door open for more hikes ‘if needed’.”
Conversely, Standard Chartered’s team detected “a more dovish slant from Governor Bullock at the press conference,” pointing out that she indicated “that a rate hike and a hold were discussed in the meeting.” Crucially, “she did not talk up the possibility of another rate hike in Q4, and emphasised the lags of monetary policy transmission from the rate hikes so far.” Against that backdrop, Standard Chartered conclude that “our takeaway remains that the central bank is probably done with rate hikes.”
Meanwhile, Australia’s trade data shows that surplus narrowed significantly in August. Earlier in the day, the Trade Balance report revealed that surplus narrowed sharply to AUD$495 million in August, from a surplus of A$1,351M in the previous reading. The August Trade Surplus was also revised lower from A$1,923M.
On the US Dollar front, investors await the United States (US) ISM Manufacturing Purchasing Managers’ Index (PMI) data for September, which will be published at 14:00 GMT.
AUD/USD Technical Analysis
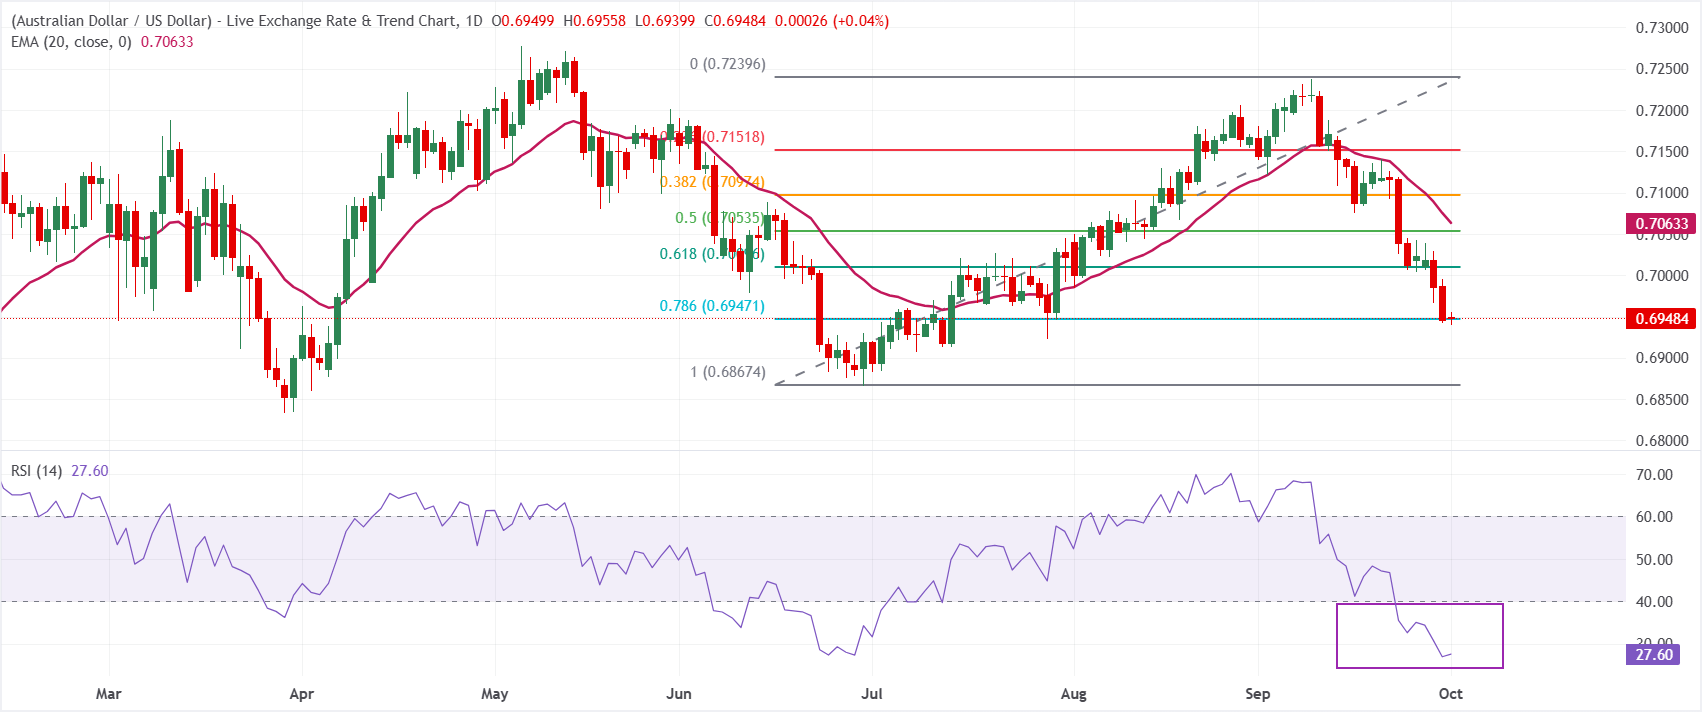
In the daily chart, AUD/USD trades at 0.6948, maintaining a bearish near-term bias as it holds beneath the 20-period Exponential Moving Average (EMA) at 0.7063 and a dense Fibonacci resistance band starting from the 61.8% retracement at 0.7010. The Relative Strength Index (RSI) at 27.6 sits in oversold territory, hinting that while downside pressure persists, the pace of the recent slide could begin to moderate rather than accelerating sharply from current levels.
On the downside, immediate support aligns with the 78.6% Fibonacci retracement at 0.6947, with a deeper structural floor at the 100.0% Fibonacci anchor near 0.6867 if selling resumes. On the topside, initial resistance is seen at the 61.8% retracement at 0.7010, followed by the 50.0% level at 0.7054 and the 20-period EMA at 0.7063, while higher barriers emerge at the 38.2% retracement at 0.7097, the 23.6% level at 0.7152, and ultimately the cycle high area around the 0.0% retracement at 0.7240.
(The technical analysis of this story was written with the help of an AI tool. Know more.)
Economic Indicator
Trade Balance (MoM)
The trade balance released by the Australian Bureau of Statistics is the difference in the value of its imports and exports of Australian goods. Export data can give an important reflection of Australian growth, while imports provide an indication of domestic demand. Trade Balance gives an early indication of the net export performance. If a steady demand in exchange for Australian exports is seen, that would turn into a positive growth in the trade balance, and that should be positive for the AUD.
Read more.Last release: Thu Oct 01, 2026 01:30
Frequency: Monthly
Actual: 495M
Consensus: -
Previous: 1,923M
Source: Australian Bureau of Statistics
Author

Sagar Dua
FXStreet
Sagar Dua is associated with the financial markets from his college days. Along with pursuing post-graduation in Commerce in 2014, he started his markets training with chart analysis.
















