Hyperliquid Price Forecast: HYPE pares gains as ETF outflows cap tentative bullish recovery
- Hyperliquid is down 2% on Thursday, trimming gains after a rebound of over 5% the previous day.
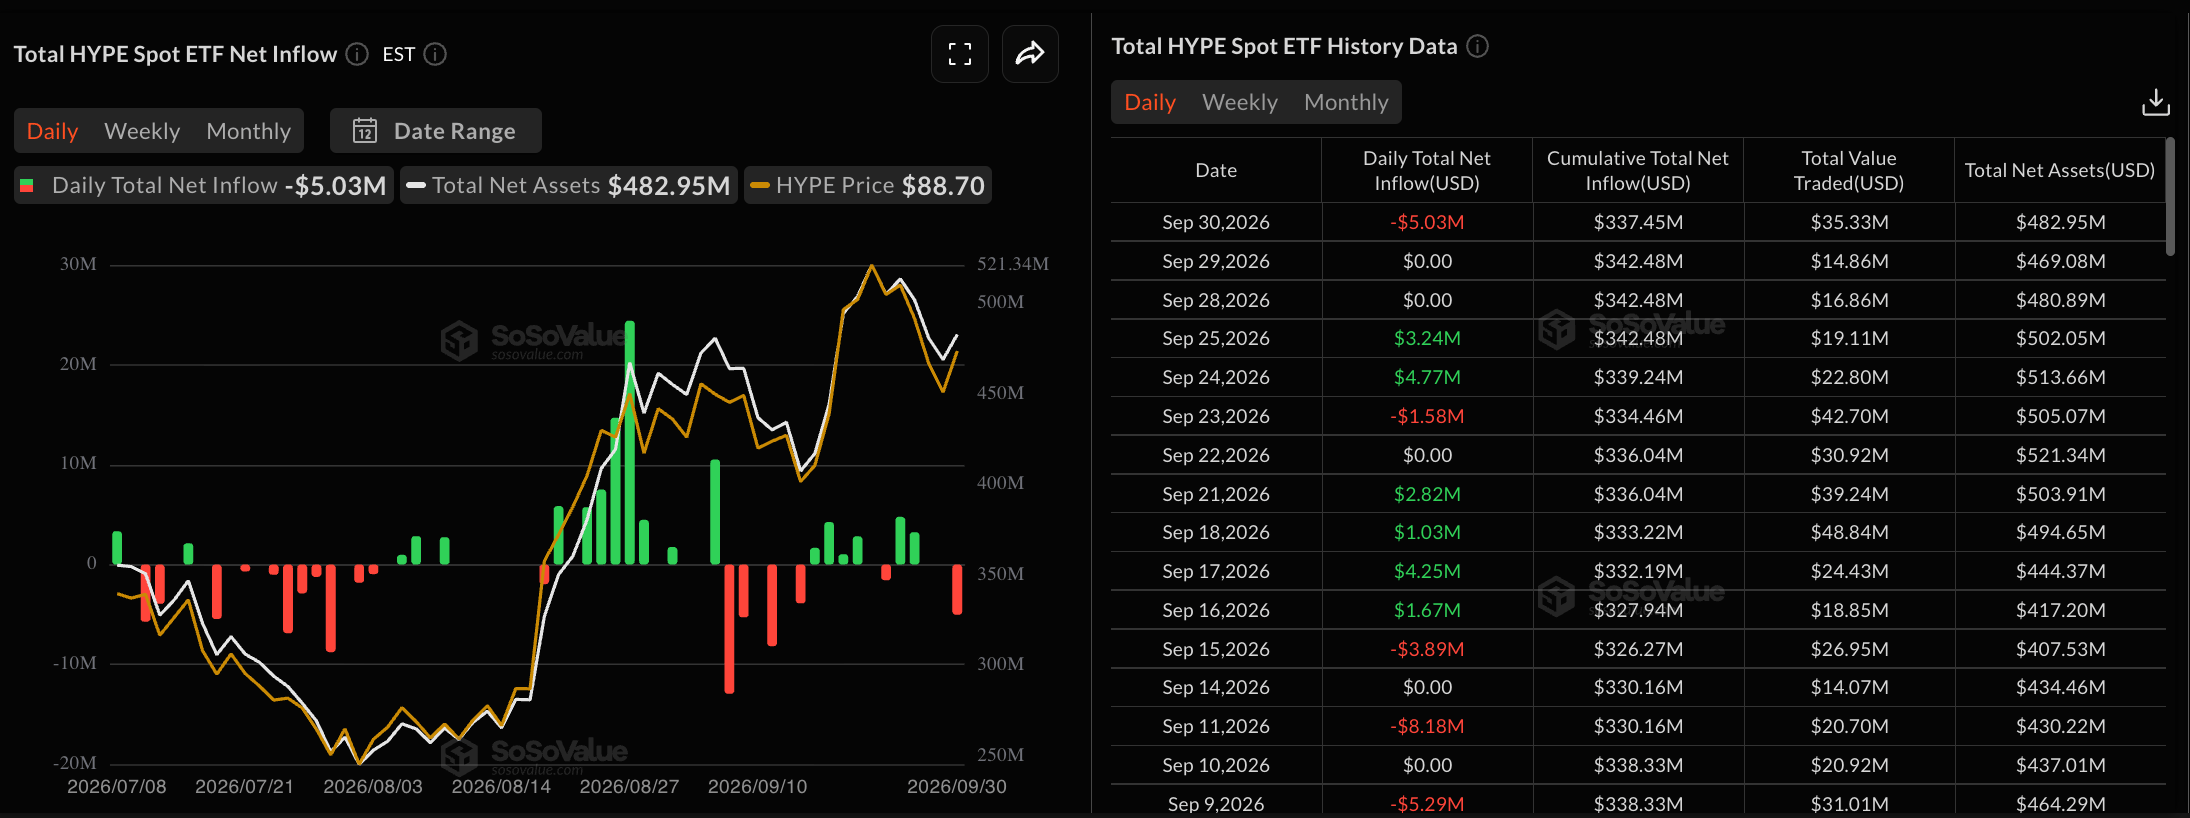
- HYPE ETFs recorded $5 million outflows on Wednesday, down from $9.25 million inflows last week, suggesting easing institutional demand.
- The technical outlook for HYPE is mixed, as the price retreats after yesterday's 5% rebound.

Hyperliquid (HYPE) is down 2% at press time on Thursday, trimming its 5% gains from the previous day. Institutional demand is easing, with $5 million in outflows on Wednesday, weighing on near-term investors' sentiment. The technical outlook for HYPE indicates a near-term mixed tone as the price remains capped below $90.
Muted institutional activity weighs on Hyperliquid
Hyperliquid shows early signs of easing institutional demand. HYPE-focused Exchange Traded Funds (ETFs) recorded $5.03 million in outflows on Wednesday after two consecutive days of zero inflows earlier this week. This outflow suggests a shift in institutional activity from last week's $9.25 million in inflows. In addition, the HYPE ETFs recorded $6.86 million in outflows in September, reinforcing the easing demand from institutional investors.
Technical outlook: Hyperliquid risks losing the rebound gains
Hyperliquid is trading below $90 at press time on Thursday, paring gains after a 5% rebound the previous day. The exchange token maintains a near-term constructive tone as it tests the 50-period Exponential Moving Average (EMA) on the four-hour chart at $89.60, while maintaining above the 100-period and 200-period EMAs at $88.55 and $84.68, underpinning a broader uptrend.
Momentum on the 4-hour chart remains mixed, with the Relative Strength Index (RSI) retreating back to the midline after a steady recovery, while the Moving Average Convergence Divergence (MACD) maintains an uptrend after crossing above its signal line the previous day.
Looking up, a potential rebound from the 50-period EMA could extend its recovery toward the $98.03 record high. A confirmed breakout above this level could claim the $100 milestone, extending the price-discovery mode.
On the flip side, the 100-period and 200-period EMAs act as nearby support levels at $88.55 and $84.68, respectively.
(The technical analysis of this story was written with the help of an AI tool. Know more.)
Author

Vishal Dixit
FXStreet
Vishal Dixit holds a B.Sc. in Chemistry from Wilson College but found his true calling in the world of crypto.