AUD/USD Price Analysis: Trading in a “range-within-a-range”
- AUD/USD is trading in a narrow range in the middle of a multi-week range.
- The pair is in a sideways trend which is expected to extend.
- The contraction in volatility may be a harbinger of great volatility to come.

AUD/USD has started trading in a mini range within a range on the 4-hour price chart. The pair has been going sideways since the middle of May but since June 19 the waves of buying and selling have narrowed still further.
AUD/USD 4-hour Chart
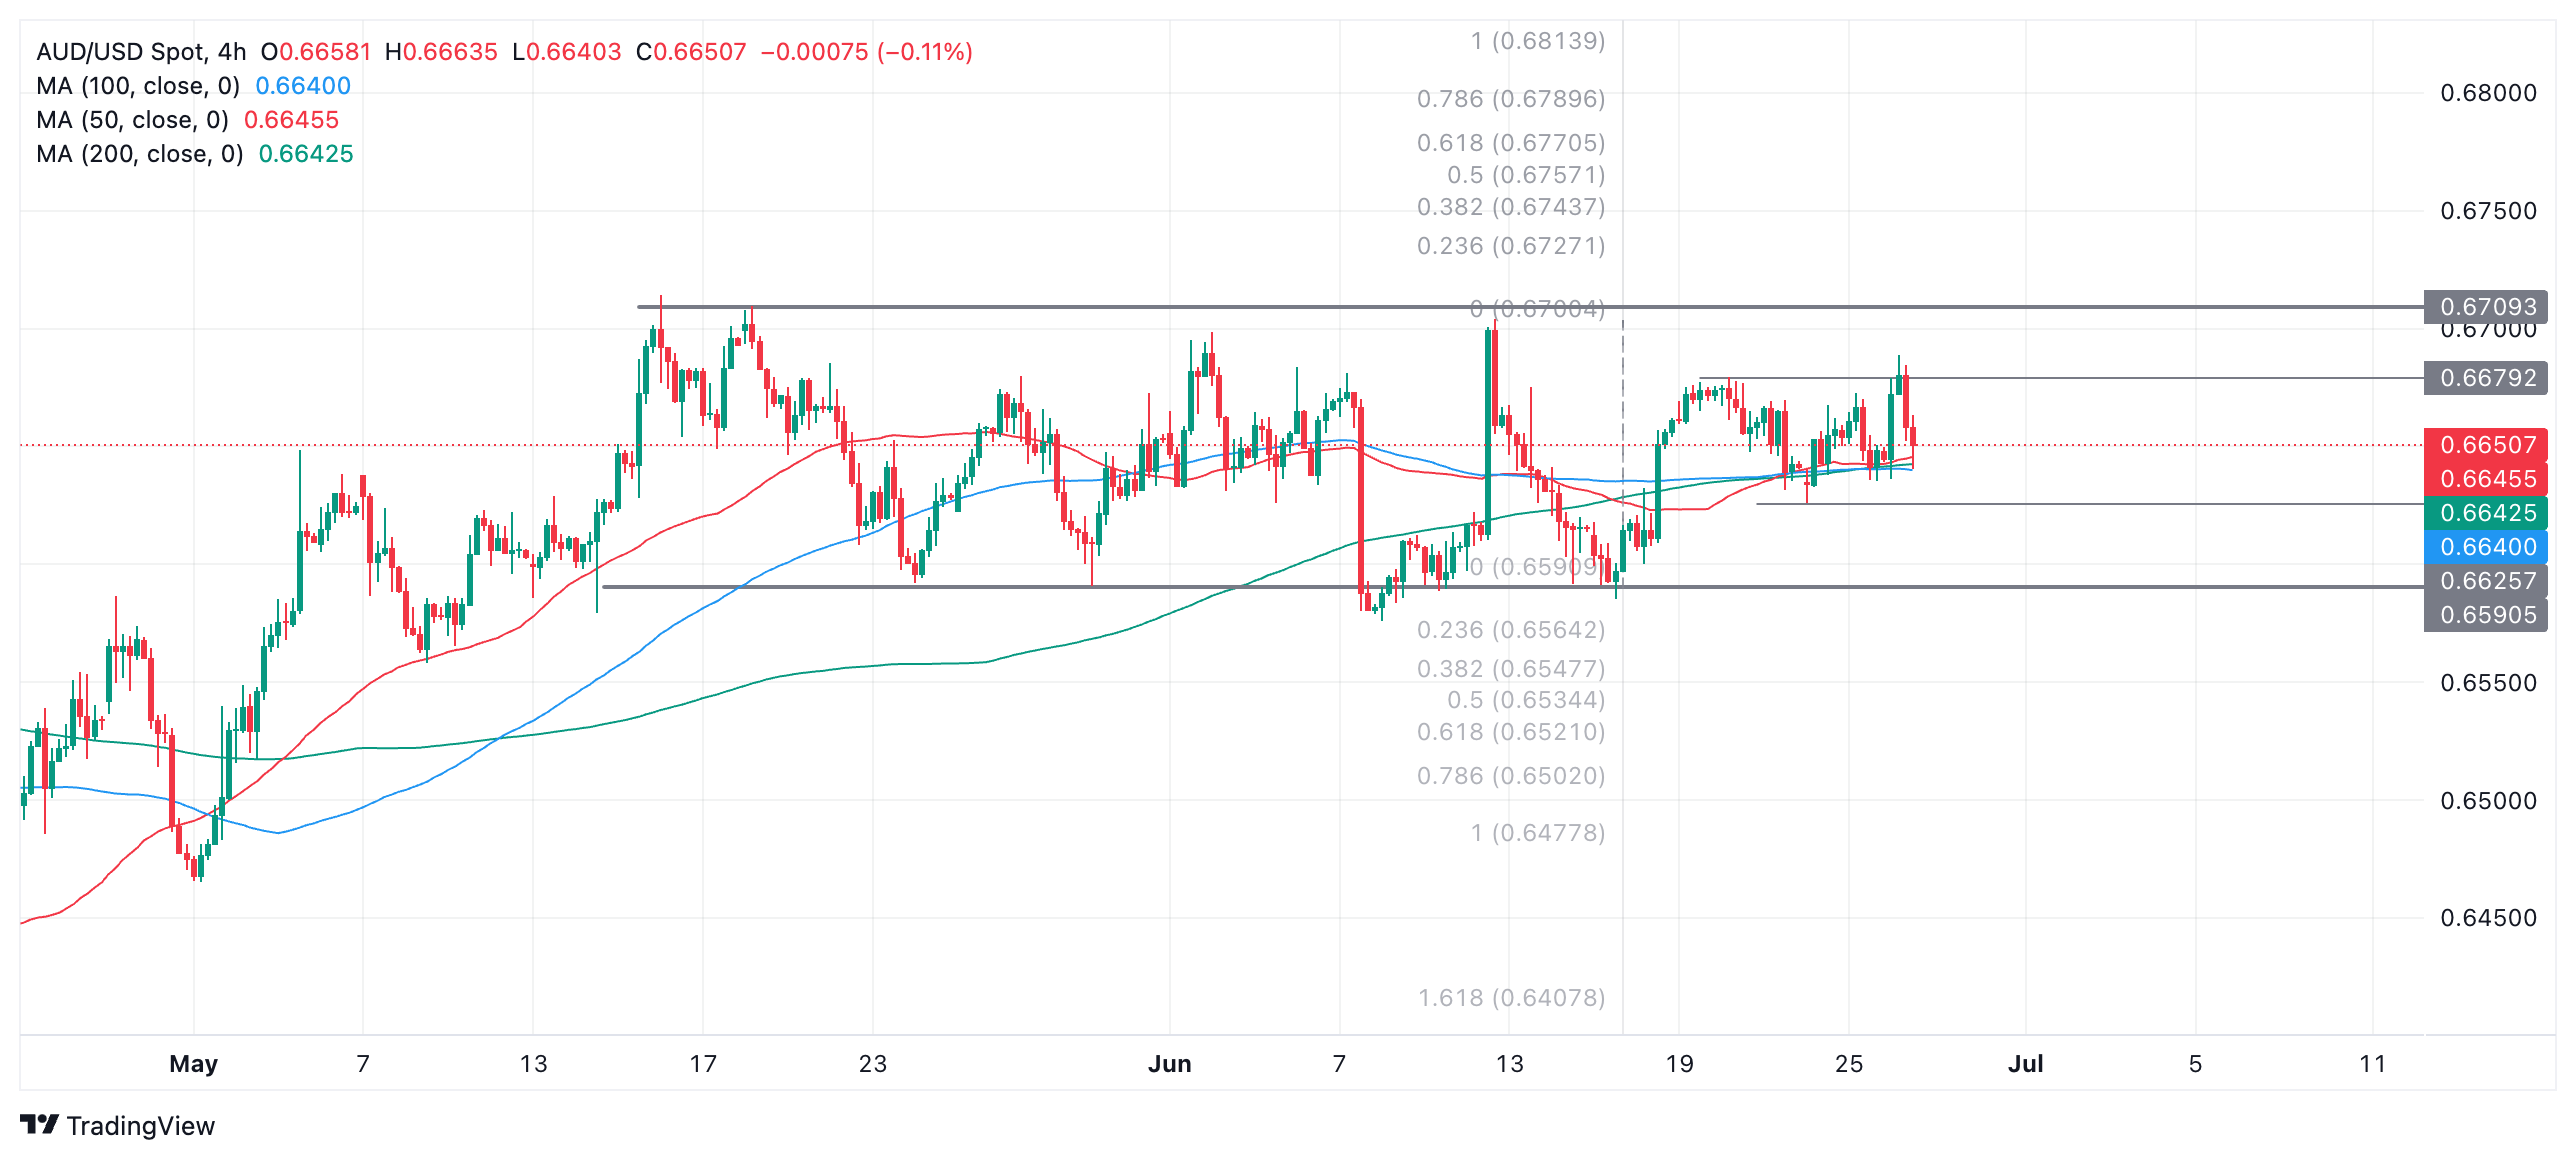
AUD/USD could move either higher or lower within the range. A break above the mini-range high at 0.6679 would probably indicate a continuation up to the range ceiling at 0.6709. Likewise a break below the mini-range low at 0.6625 would probably lead to a move down to the range floor at 0.6590.
The short-term trend is sideways and as long as price remains within the bounds of the range it will likely keep extending within the range – “the trend is your friend” after all.
Eventually the pair will break out of its range and the move is likely to be very strong since it is a general rule of markets that periods of low volatility like now are followed by periods of high volatility.
An upside breakout is marginally more likely to happen because the trend prior to the formation of the range was bullish.
A decisive break above the ceiling of the range would see a follow-through to a conservative target at 0.6770. A decisive break below the range floor on the other hand would indicate a follow-through to an initial target at 0.6521.
A decisive break would be one in which a longer-than-average candle broke out of the range and closed near its high or low, or three successive candles of the same color broke cleanly through the range top or bottom.
The targets are generated using the technical-analysis method of extrapolating the height of the range by a Fibonacci 0.618 ratio higher (in the case of an upside break) or lower (in the case of a downside break). A more generous target would come from extrapolating the full height of the range.
Author

Joaquin Monfort
FXStreet
Joaquin Monfort is a financial writer and analyst with over 10 years experience writing about financial markets and alt data. He holds a degree in Anthropology from London University and a Diploma in Technical analysis.


