|

AUD/USD Price Analysis: The break into 0.6930s has summoned the bulls to target the 0.6950s

  • The bulls are moving in and eye the 0.6950s and prior highs.
  • 0.69536 is a mid point from where the downside commenced in Monday's Tokyo open.

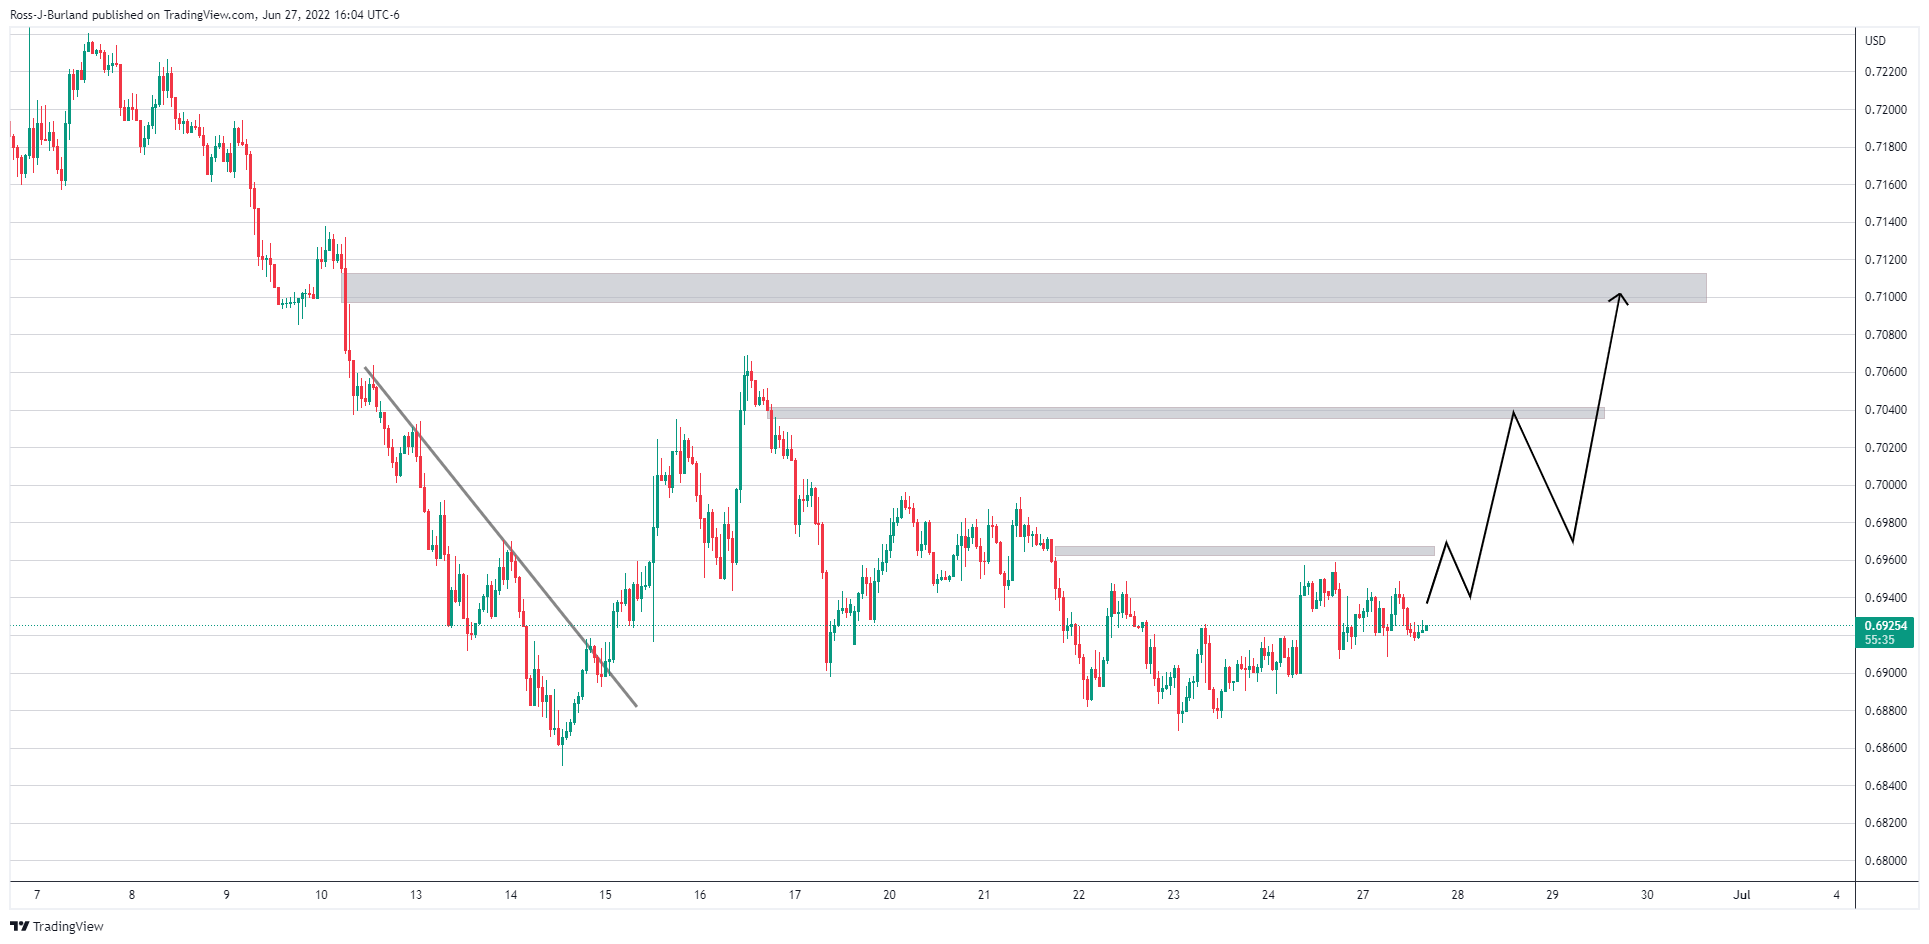
In a variation of a Wyckoff style schematic, AUD/USD, as per the prior analysis, AUD/USD bulls seek a break of 0.6925 for 0.6950 target area, the bulls have accumulated the Aussie at a discount.

The price has broken out from within the 'consolidation' following the break of 0.6925 resistance, in a ''sign of strength'' which has encouraged the bulls. The market is making fresh highs above the resistance and the following illustrates this from prior analysis down to the recent price action on a 5-min time frame.

AUD/USD prior analysis

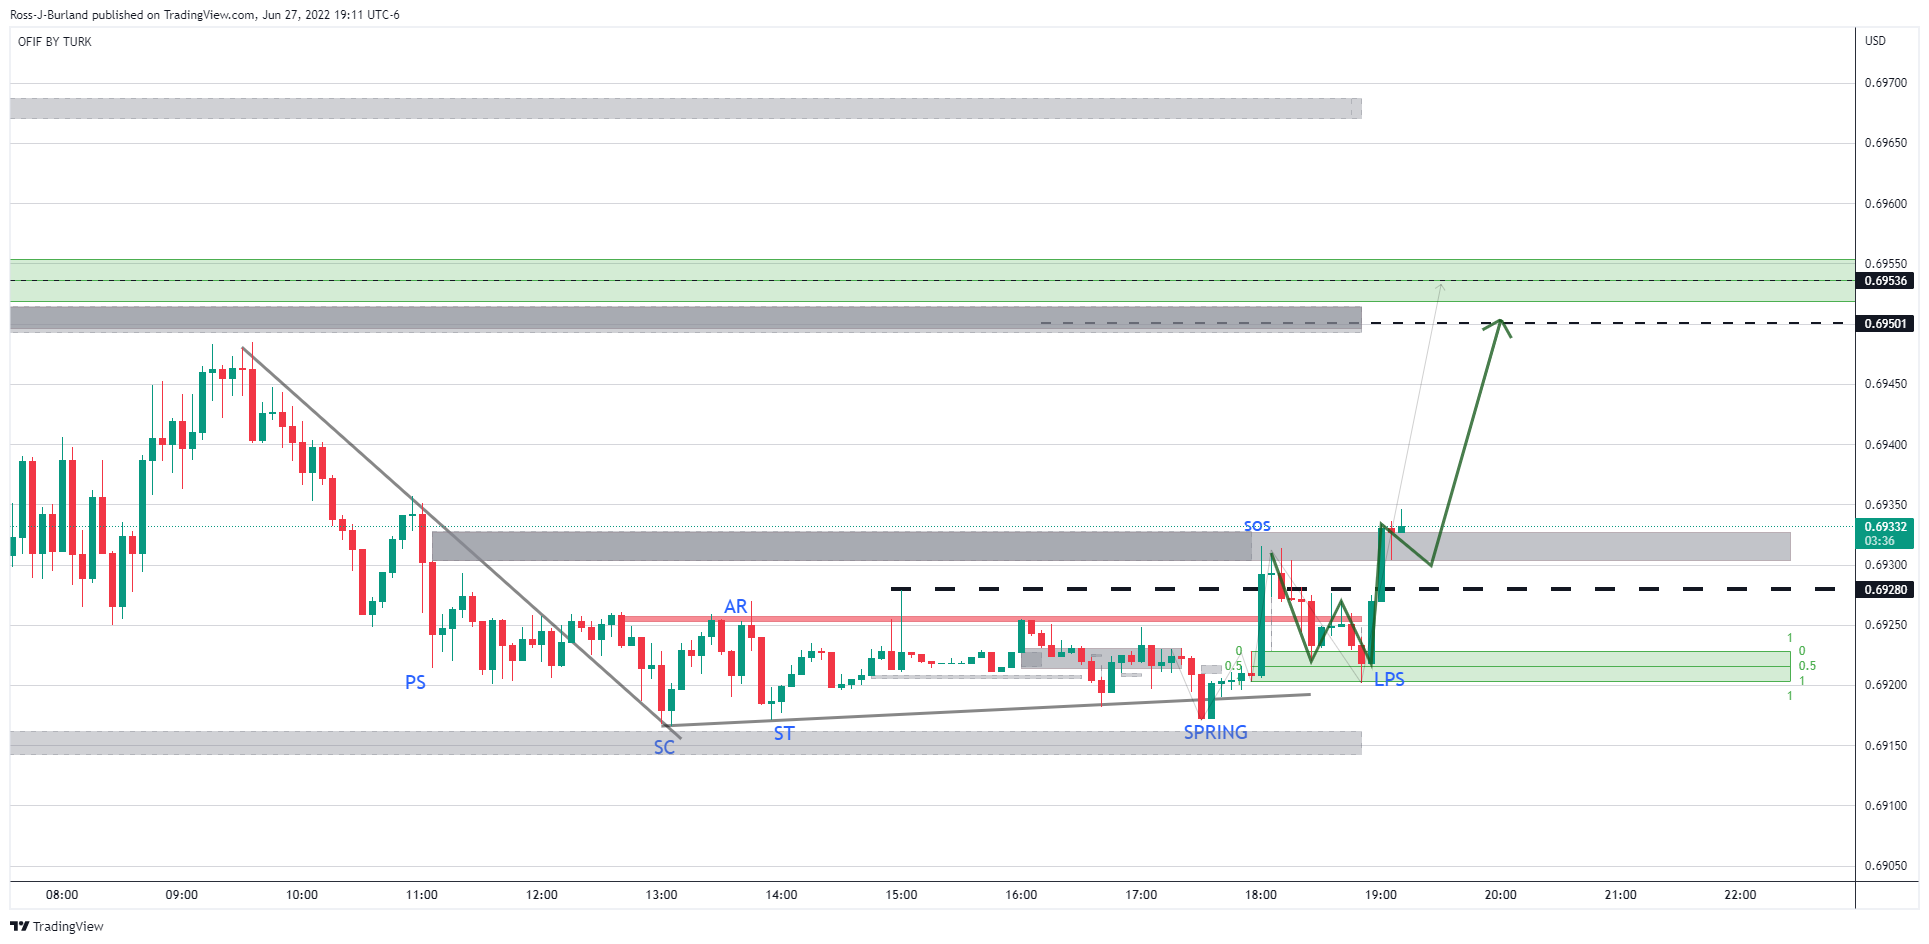
AUD/USD live 5-min charts

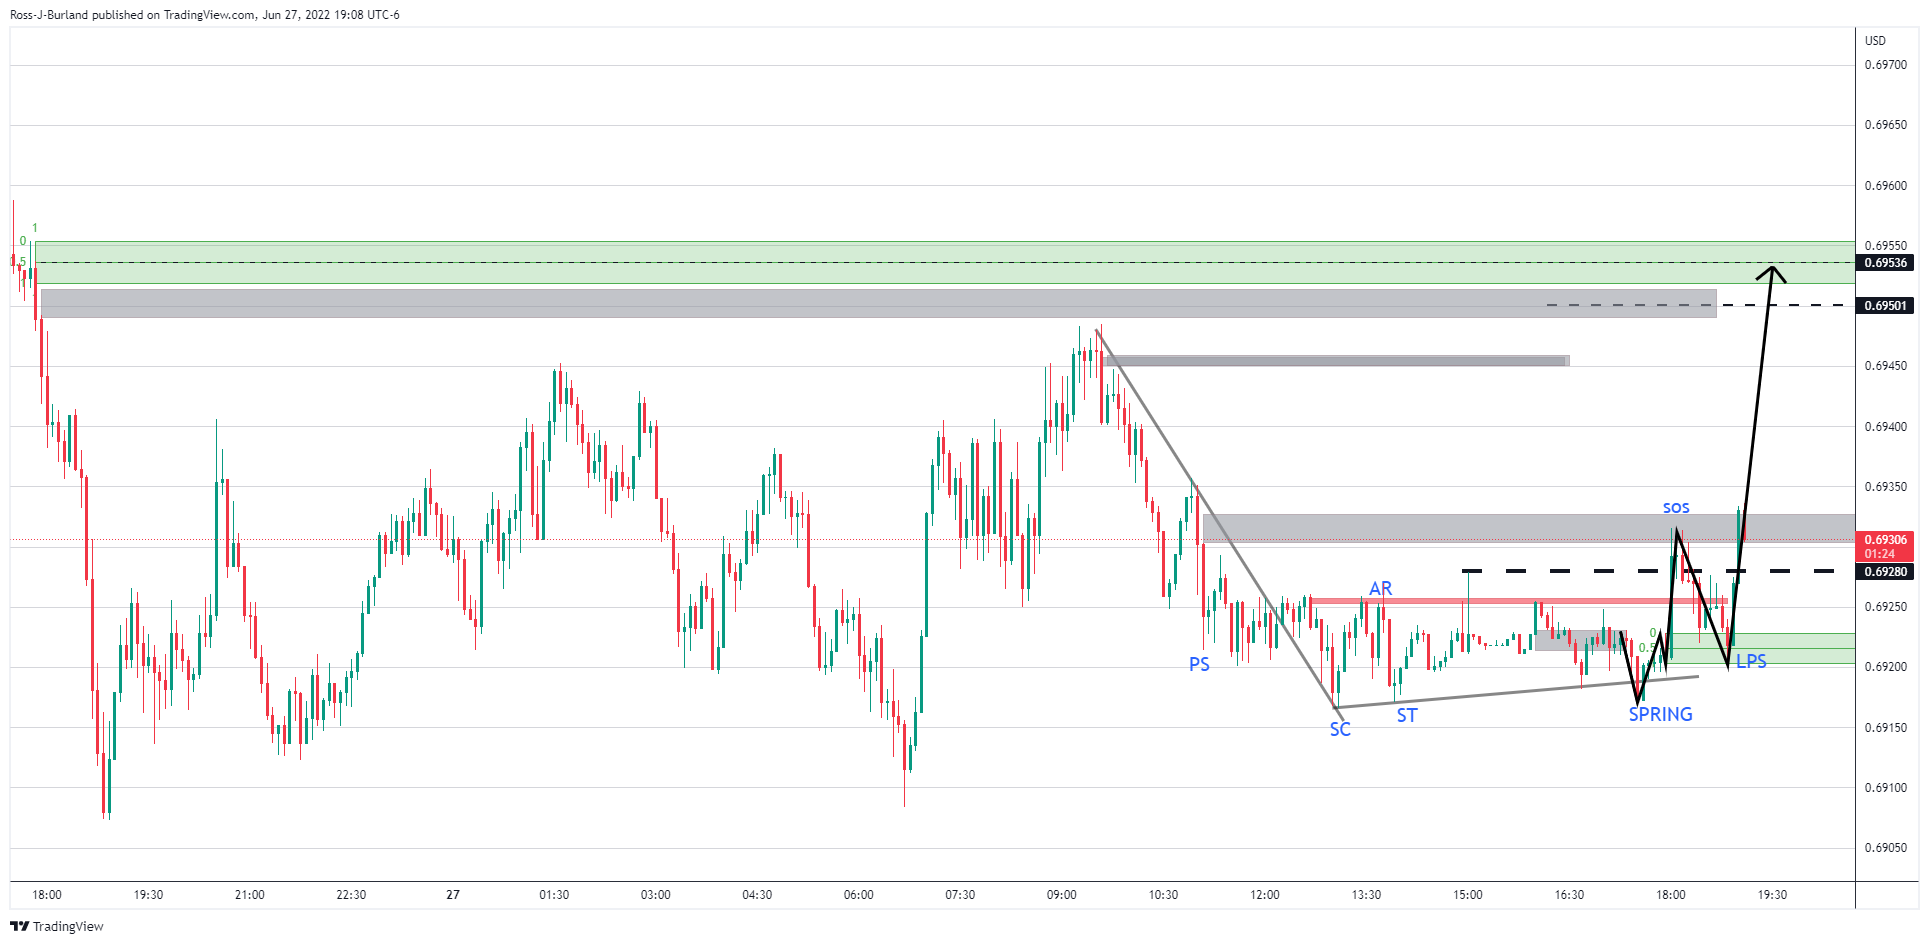
In the above schematic, the W-formation was identified and the last point of support, LPS, gave a perfect entry for the bulls seeking a discount. Below, a secondary W-formation was formed from which the price has rallied from a test of the first leg of the pattern and its resistance: 

The price is taking off but there are risks of further mitigation of price imbalances until 0.6924. Should the bulls manage to stay in control from between here and there, then the upside is compelling for a test of the 0.6950s and prior highs. 0.69536 is a mid point of a prior order block from where the downside commenced in Monday's Tokyo open.

Author

Ross J Burland

Ross J Burland, born in England, UK, is a sportsman at heart. He played Rugby and Judo for his county, Kent and the South East of England Rugby team.

More from Ross J Burland
Share:

Editor's Picks

EUR/USD seems fragile below 1.1700 as Middle East war boosts energy prices

The EUR/USD pair trades flat at around 1.1680 during the Asian trading session on Tuesday, but broadly seems vulnerable, being close to its five-week low. The major currency pair is under pressure as surging oil prices due to the United States-Israel war with Iran have increased the risks of higher inflation for the Old Continent.

GBP/USD hovers around 1.3400 with bearish pressure intact

GBP/USD edges higher after three days of losses, trading around 1.3400 during the Asian hours on Tuesday. The technical analysis of the daily chart indicates an ongoing bearish bias, as the pair trades within a descending channel pattern.

Gold sticks to gains above $5,350 amid sustained safe-haven demand; firmer USD caps gains

Gold sticks to its positive bias for the third straight day and trades above the $5,350 level heading into the European session on Tuesday. Concerns about a broader regional conflict in the Middle East continue to weigh on investors' sentiment and underpin demand for the traditional safe-haven bullion.

Stellar risks deeper losses as derivatives metrics turn negative

Stellar is trading red below $0.16 at the time of writing on Tuesday, after a slight recovery the previous day. Weakening derivatives data caps the recovery, while an unfavorable technical outlook projects a deeper correction for the XLM token in the upcoming days.

The market is not panicking it is repricing the probability distribution of Oil and time

At the end of the day, markets do not trade morality or geopolitics. They trade transmission channels. And the only channel that truly matters in this maelstrom runs through the price of energy and the time value of money.

Hyperliquid Price Forecast: HYPE rises on commodities demand amid US-Iran war

Hyperliquid (HYPE) steadies above $33 at press time on Tuesday, marking its fourth consecutive day of recovery in a broadly volatile market due to the ongoing US-Israel strikes on Iran.